Free Access
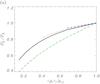
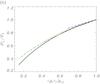
Fig. 4
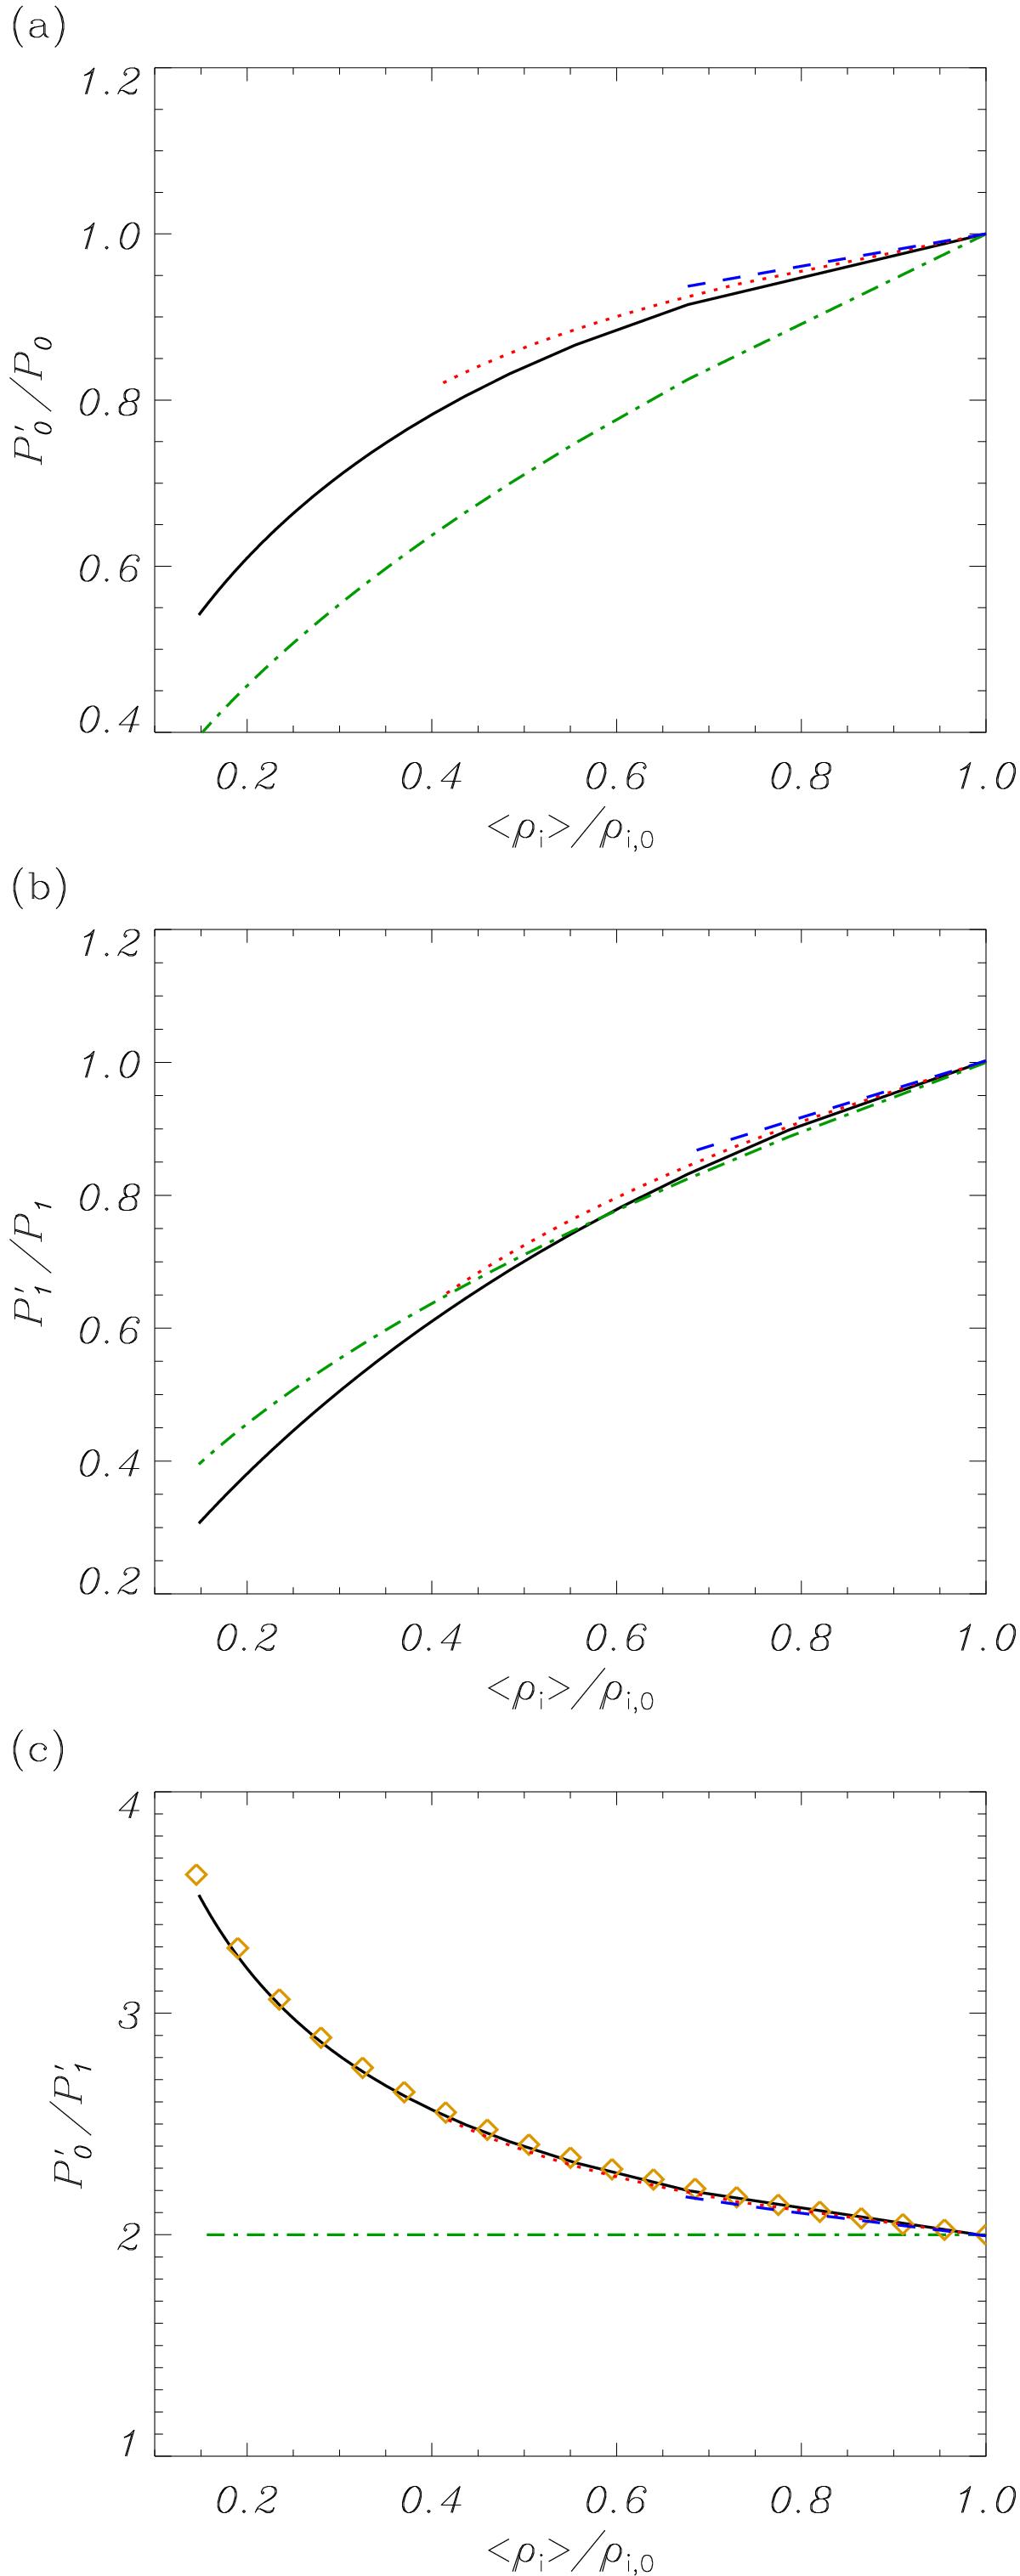
Same results as Fig. 3 but as a function of the ratio of the average internal density to the central density, ⟨ρi⟩ /ρi,0. For comparison, the green dash-dotted line shows the result for a homogeneous thread with ρi = ⟨ρi⟩, i.e., the average thread. The symbols in panel c) correspond to the empirical fit of Eq. (17).
This figure is made of several images, please see below:
Current usage metrics show cumulative count of Article Views (full-text article views including HTML views, PDF and ePub downloads, according to the available data) and Abstracts Views on Vision4Press platform.
Data correspond to usage on the plateform after 2015. The current usage metrics is available 48-96 hours after online publication and is updated daily on week days.
Initial download of the metrics may take a while.