Fig. 1
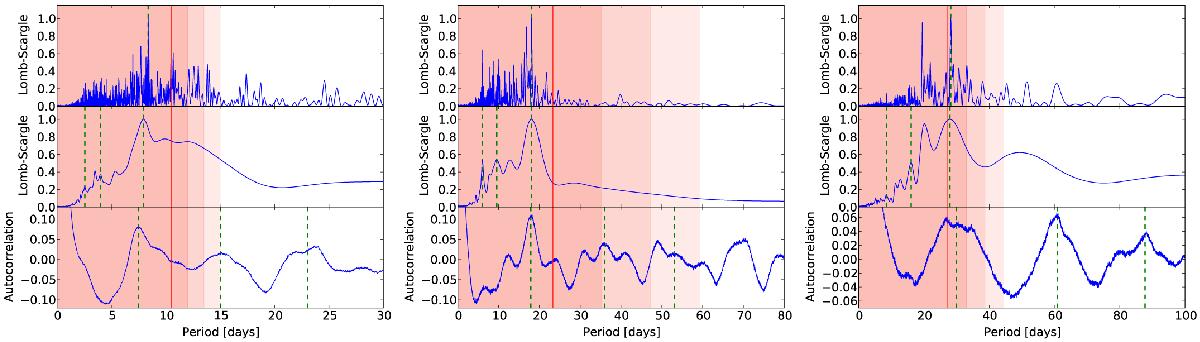
From left to right: periodograms of KOI-206, KOI-614, and KOI-680. Top panels: Lomb-Scargle periodogram of the complete light curve. Middle panels: mean Lomb-Scargle periodogram of the light curve divided in chunks. Bottom panels: light curve autocorrelation. The green dashed lines indicate the center of Gaussians fitted to the data to derive the main frequency and its harmonics. The red vertical line corresponds to the maximum rotation period deduced from the vsini⋆ and the star radius, and the shaded areas are the associated 1, 2, and 3σ upper limit regions from the darkest to the lighter ones, respectively.
Current usage metrics show cumulative count of Article Views (full-text article views including HTML views, PDF and ePub downloads, according to the available data) and Abstracts Views on Vision4Press platform.
Data correspond to usage on the plateform after 2015. The current usage metrics is available 48-96 hours after online publication and is updated daily on week days.
Initial download of the metrics may take a while.