Fig. 3
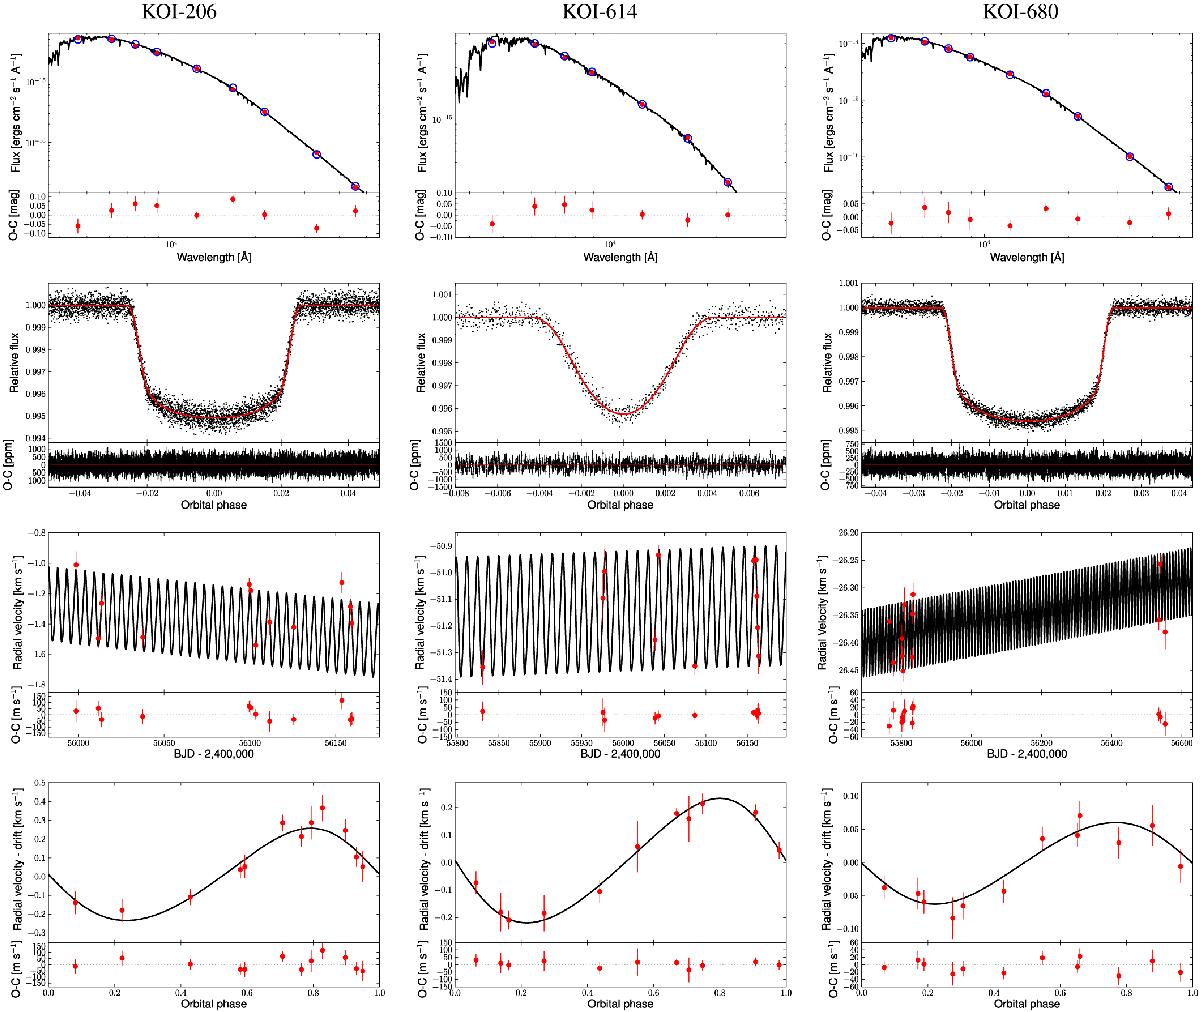
Model of the maximum likelihood step of the merged chain of KOI-206, KOI-614, and KOI-680 (from left to right columns) plotted with the data. From top to bottom: SED, light curve, radial velocity in time, and radial velocity in phase. In the bottom panels: residuals after subtracting the model to the observed data. SED plot: the solid line plots the PHOENIX/BT-Settl interpolated synthetic spectrum, in red circles the absolute photometric observations listed in Table 2, in blue open circles the result of integrated the synthetic spectrum in the observed bandpasses. Light curve plot: folded transit observed by Kepler in long-the black solid line plots the Keplerian model a for the radial velocities and red circles the SOPHIE observations.
Current usage metrics show cumulative count of Article Views (full-text article views including HTML views, PDF and ePub downloads, according to the available data) and Abstracts Views on Vision4Press platform.
Data correspond to usage on the plateform after 2015. The current usage metrics is available 48-96 hours after online publication and is updated daily on week days.
Initial download of the metrics may take a while.