Fig. 2
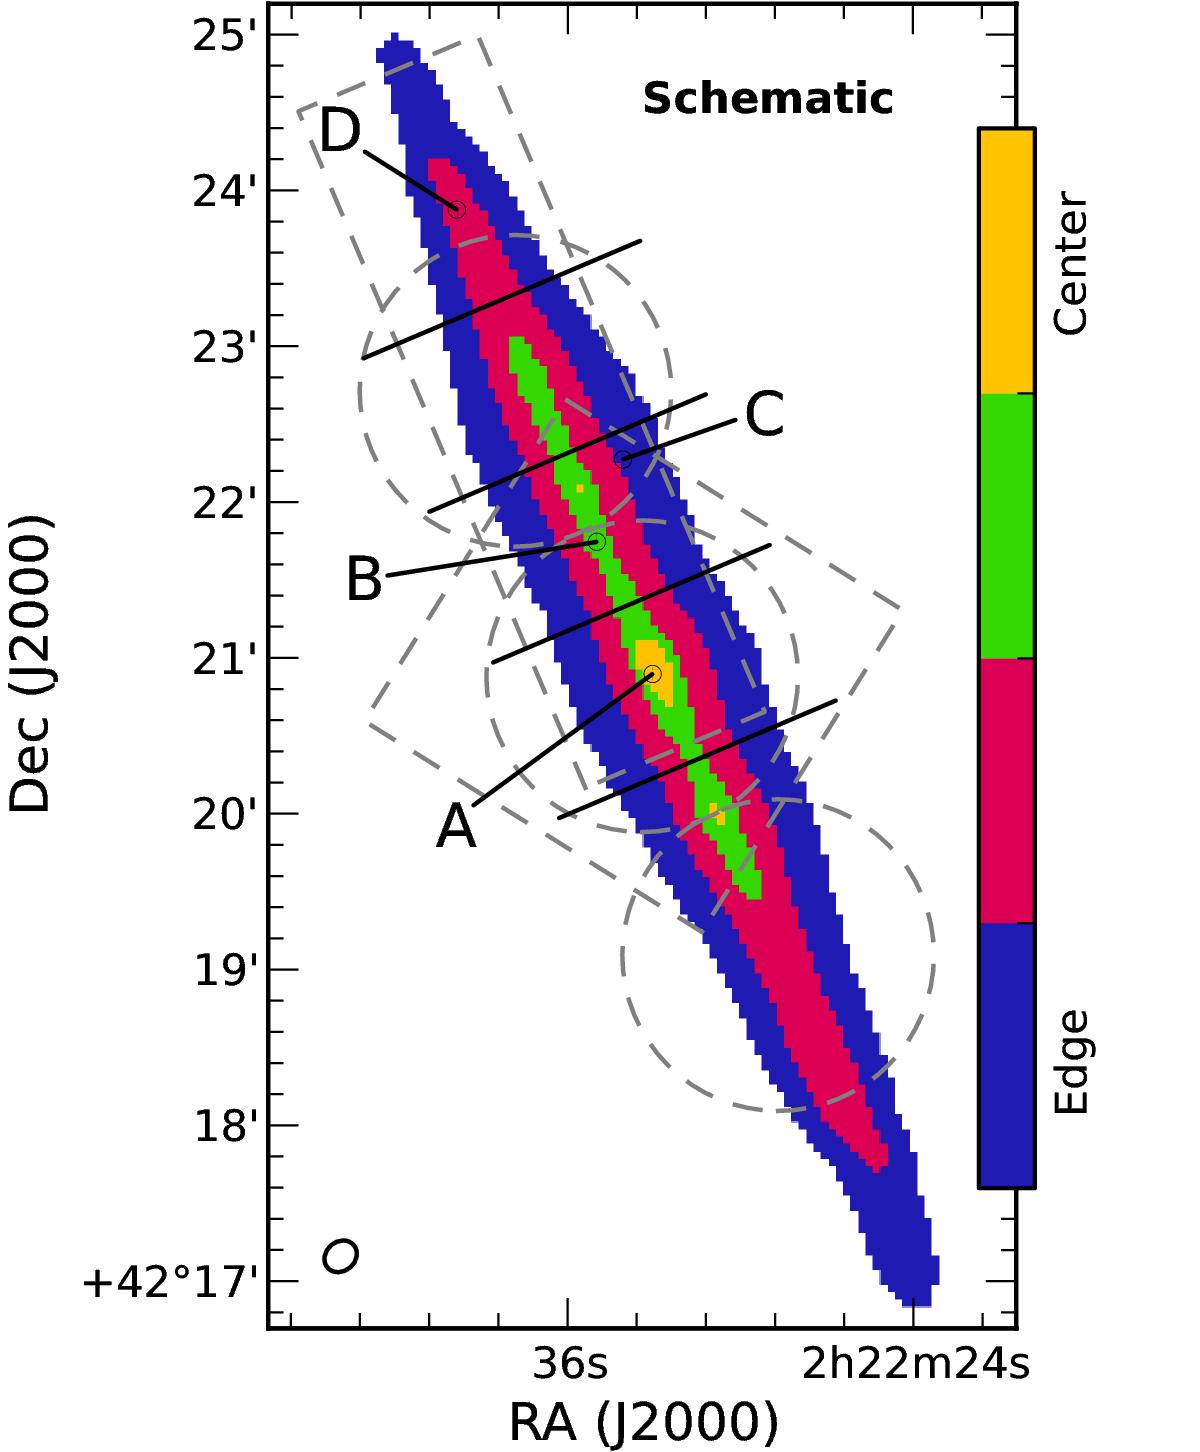
Schematic diagram of the radial bins (divided by solid black lines) and the four regions based on the TIR flux density (see Sect. 2.3 and Fig. 1) that we use in our analysis to search for regional variations in the gas properties. Labels A-D mark positions of the typical line spectra shown in Fig. 3. The dashed grey lines demarcate the coverage of the PACS and SPIRE spectroscopic maps for reference.
Current usage metrics show cumulative count of Article Views (full-text article views including HTML views, PDF and ePub downloads, according to the available data) and Abstracts Views on Vision4Press platform.
Data correspond to usage on the plateform after 2015. The current usage metrics is available 48-96 hours after online publication and is updated daily on week days.
Initial download of the metrics may take a while.