Fig. 3
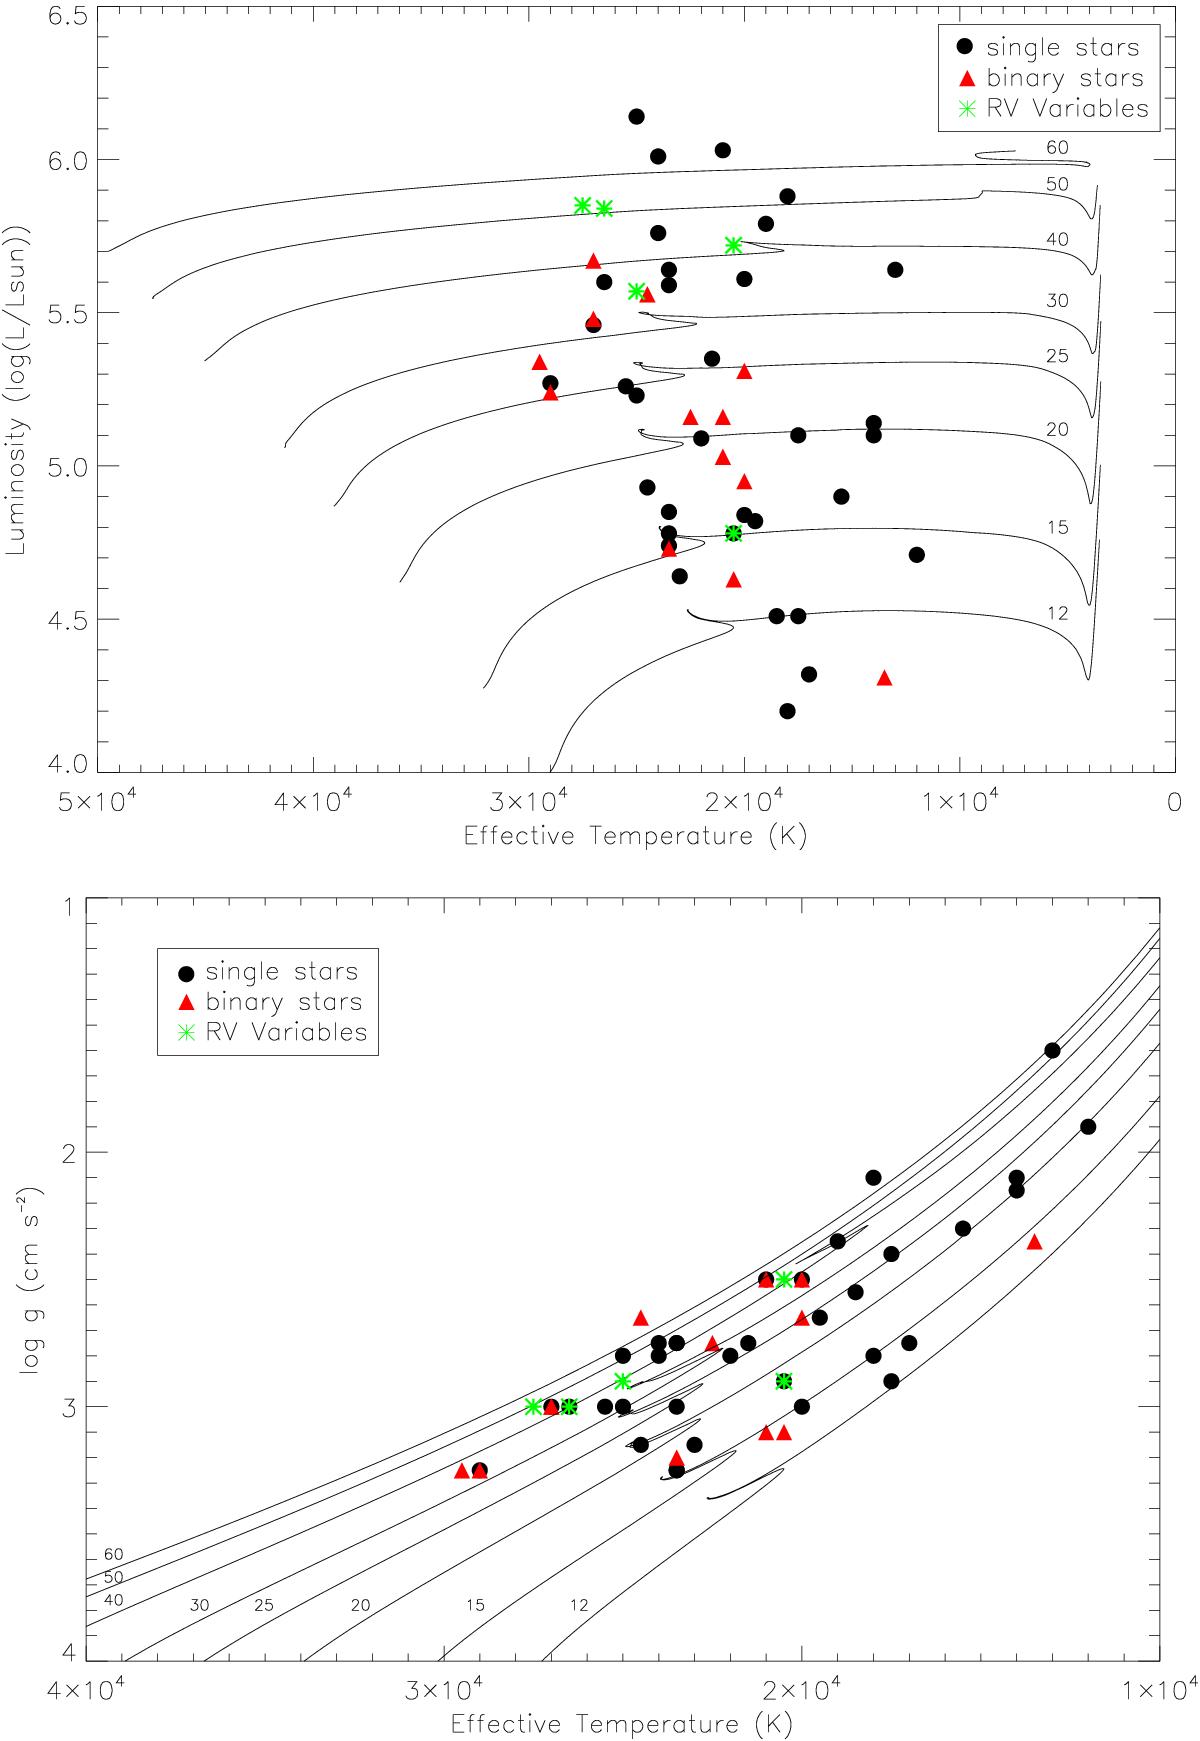
Top: classic Hertzsprung-Russell diagram for the single (circle) and binary (triangle) supergiants. Also shown are the single-star LMC evolutionary tracks of Brott et al. (2011) for vo≃ 225 km s-1, with the initial mass (in units of the solar mass) given on the right hand side. Bottom: analogous plot showing effective temperatures versus logarithmic surface gravity. The same evolutionary tracks are plotted, this time with the initial masses given at the bottom of each track. The green stars in both represent the five stars referred to in Sect. 2.1 as radial velocity variables.
Current usage metrics show cumulative count of Article Views (full-text article views including HTML views, PDF and ePub downloads, according to the available data) and Abstracts Views on Vision4Press platform.
Data correspond to usage on the plateform after 2015. The current usage metrics is available 48-96 hours after online publication and is updated daily on week days.
Initial download of the metrics may take a while.