Fig. 8
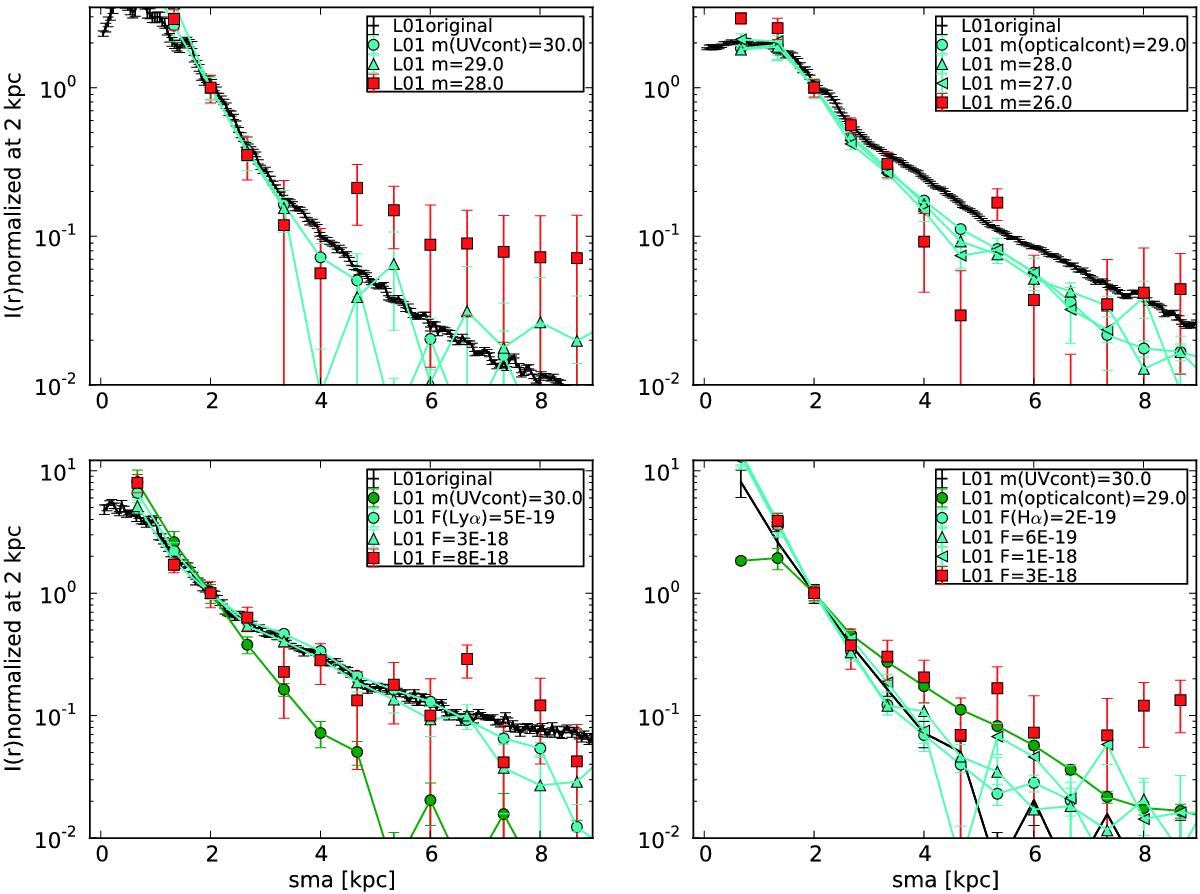
Normalized surface brightness profiles of z2L01. The semi-major axis of an elliptical aperture is indicated as sma. Black points with error bars correspond to the surface brightness profile of the original LARS images in the rest-frame UV, optical, and Lyα line. The red squares represent the profiles at the limits of detection. The profiles indicated with circles(triangles) correspond to the deepest(intermediate) depth surveys. In the upper left panel we show the original rest-frame UV profile and the one at a depth of mrest − UV = 30, 29(cyan) and 28(red). In the upper right panel the original rest-frame optical profile, the one at a depth of mrest − optical = 29,28,27(cyan), and 26(red). In the lower left the original Lyα profile, the one at a depth of F(Lyα) = 5E-19, 3E-18(cyan), and 8E-18(red), together with the deepest-survey rest-frame UV profile (green circle and line). In the lowerright the Hα profile at a depth of F(Hα) = 2E-19, 6E-19(cyan), and 1E-18(red), together with the deepest-survey rest-frame optical profile (green circle and line) and the deepest-survey rest-frame UV profile (black line with error bars).
Current usage metrics show cumulative count of Article Views (full-text article views including HTML views, PDF and ePub downloads, according to the available data) and Abstracts Views on Vision4Press platform.
Data correspond to usage on the plateform after 2015. The current usage metrics is available 48-96 hours after online publication and is updated daily on week days.
Initial download of the metrics may take a while.