Fig. 10
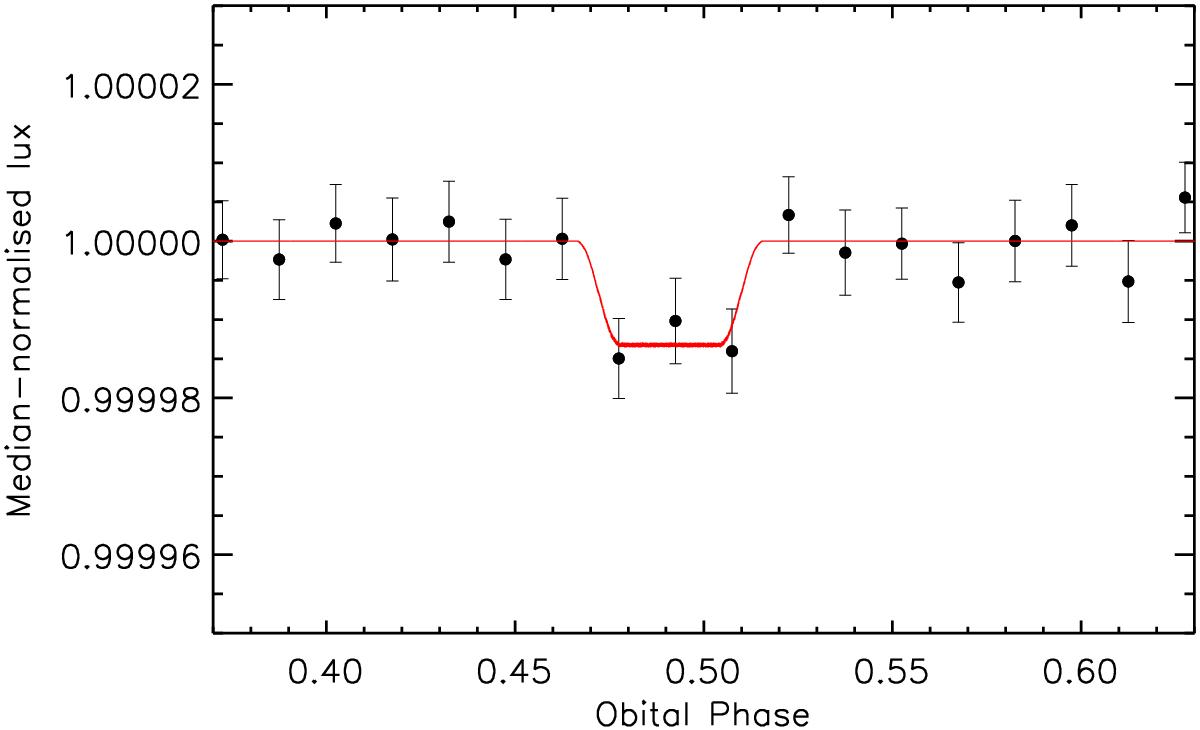
Secondary eclipse light curve of Kepler-423, phase-folded to the orbital period of the planet. Kepler data are median-binned in intervals of 0.015 cycles in phase (~1 h). The 1σ error bars are the median absolute deviations of the data points inside the bin, divided by the square root of the number of points. The best fitting transit model is overplotted with a red line.
Current usage metrics show cumulative count of Article Views (full-text article views including HTML views, PDF and ePub downloads, according to the available data) and Abstracts Views on Vision4Press platform.
Data correspond to usage on the plateform after 2015. The current usage metrics is available 48-96 hours after online publication and is updated daily on week days.
Initial download of the metrics may take a while.