Fig. 11
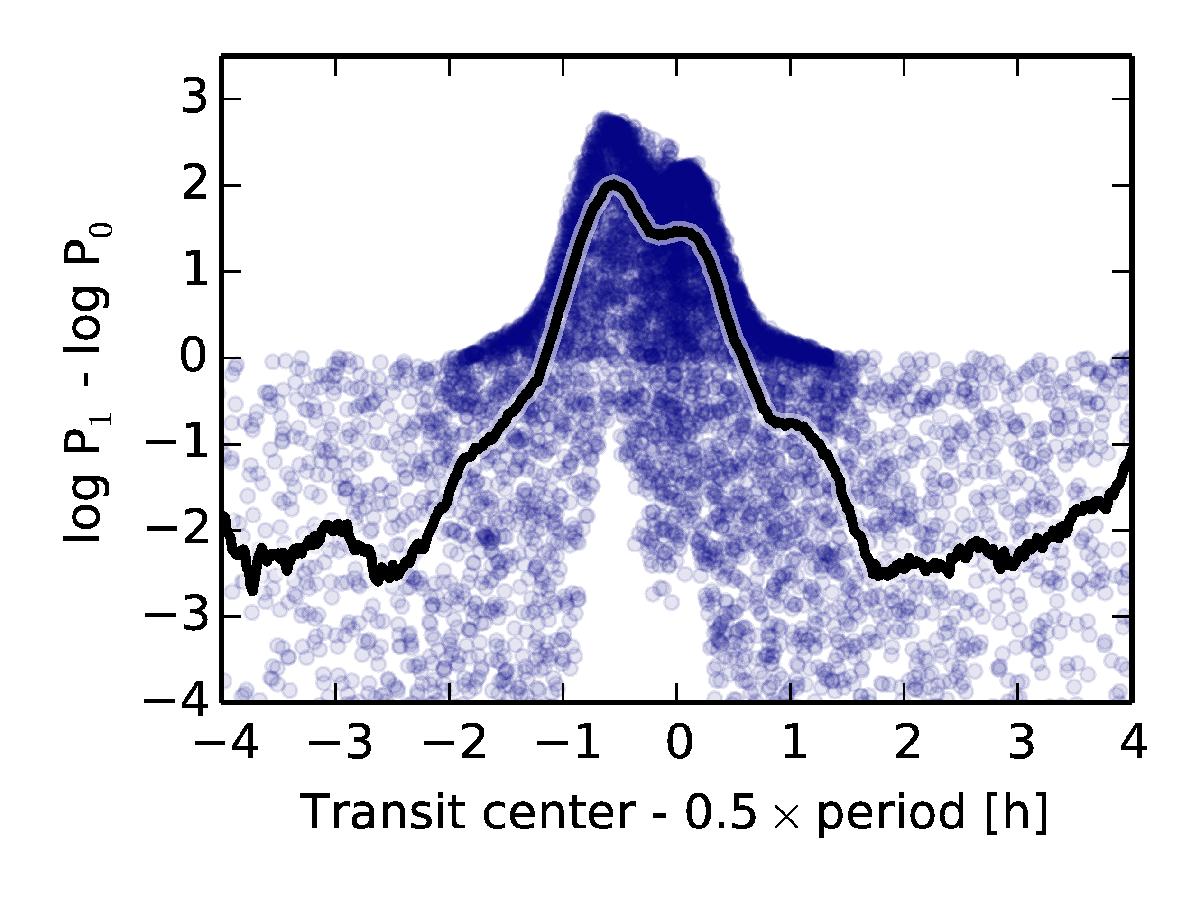
Differences between the individual posterior samples for the eclipse model (M1) and no-eclipse model (M0) plotted against the eclipse centre (light blue circles), mapped from the sampling space that uses eccentricity and argument of periastron. Only 447 LC segments are used for the modelling (see Sect. 5.2). A Bayes factor map produced by sliding a uniform prior with a width of 15 min along the transit centre is overlaid with a black thick line.
Current usage metrics show cumulative count of Article Views (full-text article views including HTML views, PDF and ePub downloads, according to the available data) and Abstracts Views on Vision4Press platform.
Data correspond to usage on the plateform after 2015. The current usage metrics is available 48-96 hours after online publication and is updated daily on week days.
Initial download of the metrics may take a while.