Fig. 12
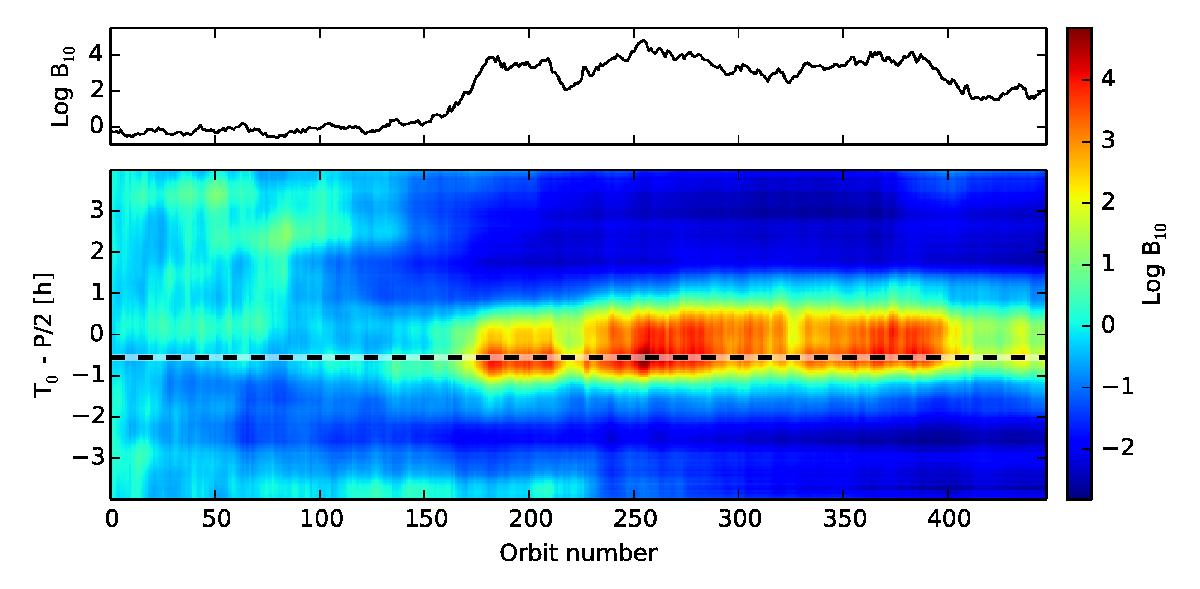
The cumulation of log B10 as a function of increasing data. The plot shows only the 447 orbits used for the secondary eclipse modelling (see Sect. 5.2). The upper plot shows the trace for the maximum log B10 case (identified as a slashed line in the lower plot), and the lower plot shows log B10 mapped as a function of a sliding prior on the eclipse centre (as in Fig. 11) on the y-axis, with the amount of data (number of orbits included) increasing on the x-axis.
Current usage metrics show cumulative count of Article Views (full-text article views including HTML views, PDF and ePub downloads, according to the available data) and Abstracts Views on Vision4Press platform.
Data correspond to usage on the plateform after 2015. The current usage metrics is available 48-96 hours after online publication and is updated daily on week days.
Initial download of the metrics may take a while.