Fig. 4
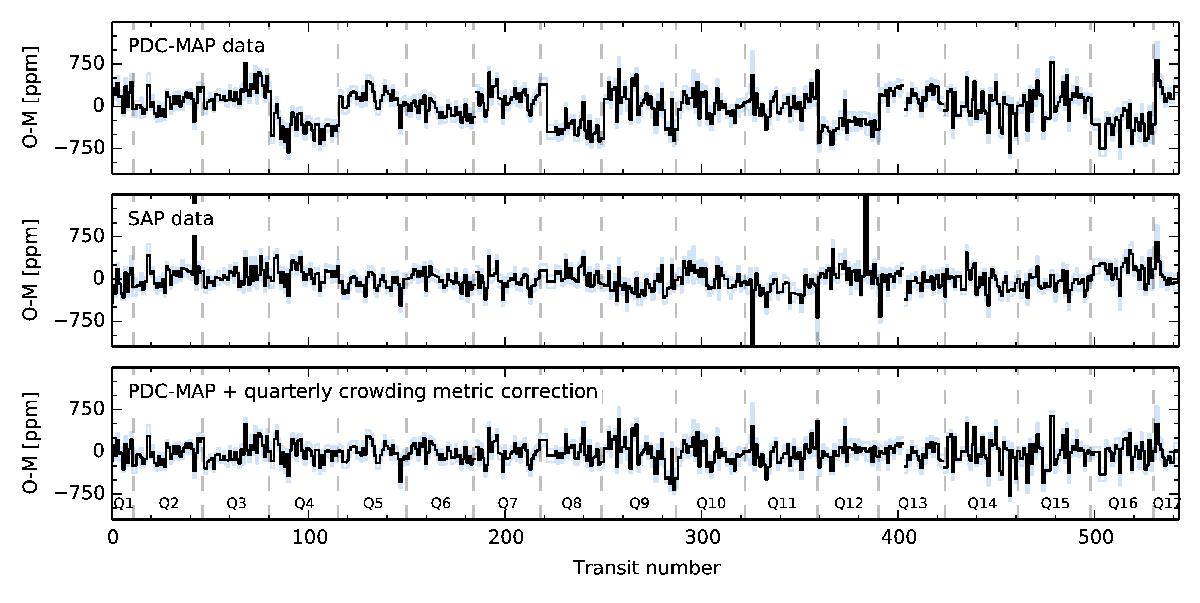
Upper panel: average, observed−modelled (O − M) flux residual of the photometric points encompassing the second (T2) and third transit contact (T3) as a function of the transit numbers for the PDC-MAP data, assuming that the Kepler contamination metric has been properly estimated. The light blue lines show the standard error of the mean for each transit. The beginning of each Kepler quarter is marked with dashed grey vertical lines. Middle panel: as in the upper panel, but for the SAP data. Lower panel: same as before, but for the PDC-MAP cotrended data, following our quarterly crowding metric correction constrained by an informative prior (see text for more details).
Current usage metrics show cumulative count of Article Views (full-text article views including HTML views, PDF and ePub downloads, according to the available data) and Abstracts Views on Vision4Press platform.
Data correspond to usage on the plateform after 2015. The current usage metrics is available 48-96 hours after online publication and is updated daily on week days.
Initial download of the metrics may take a while.