Fig. 5
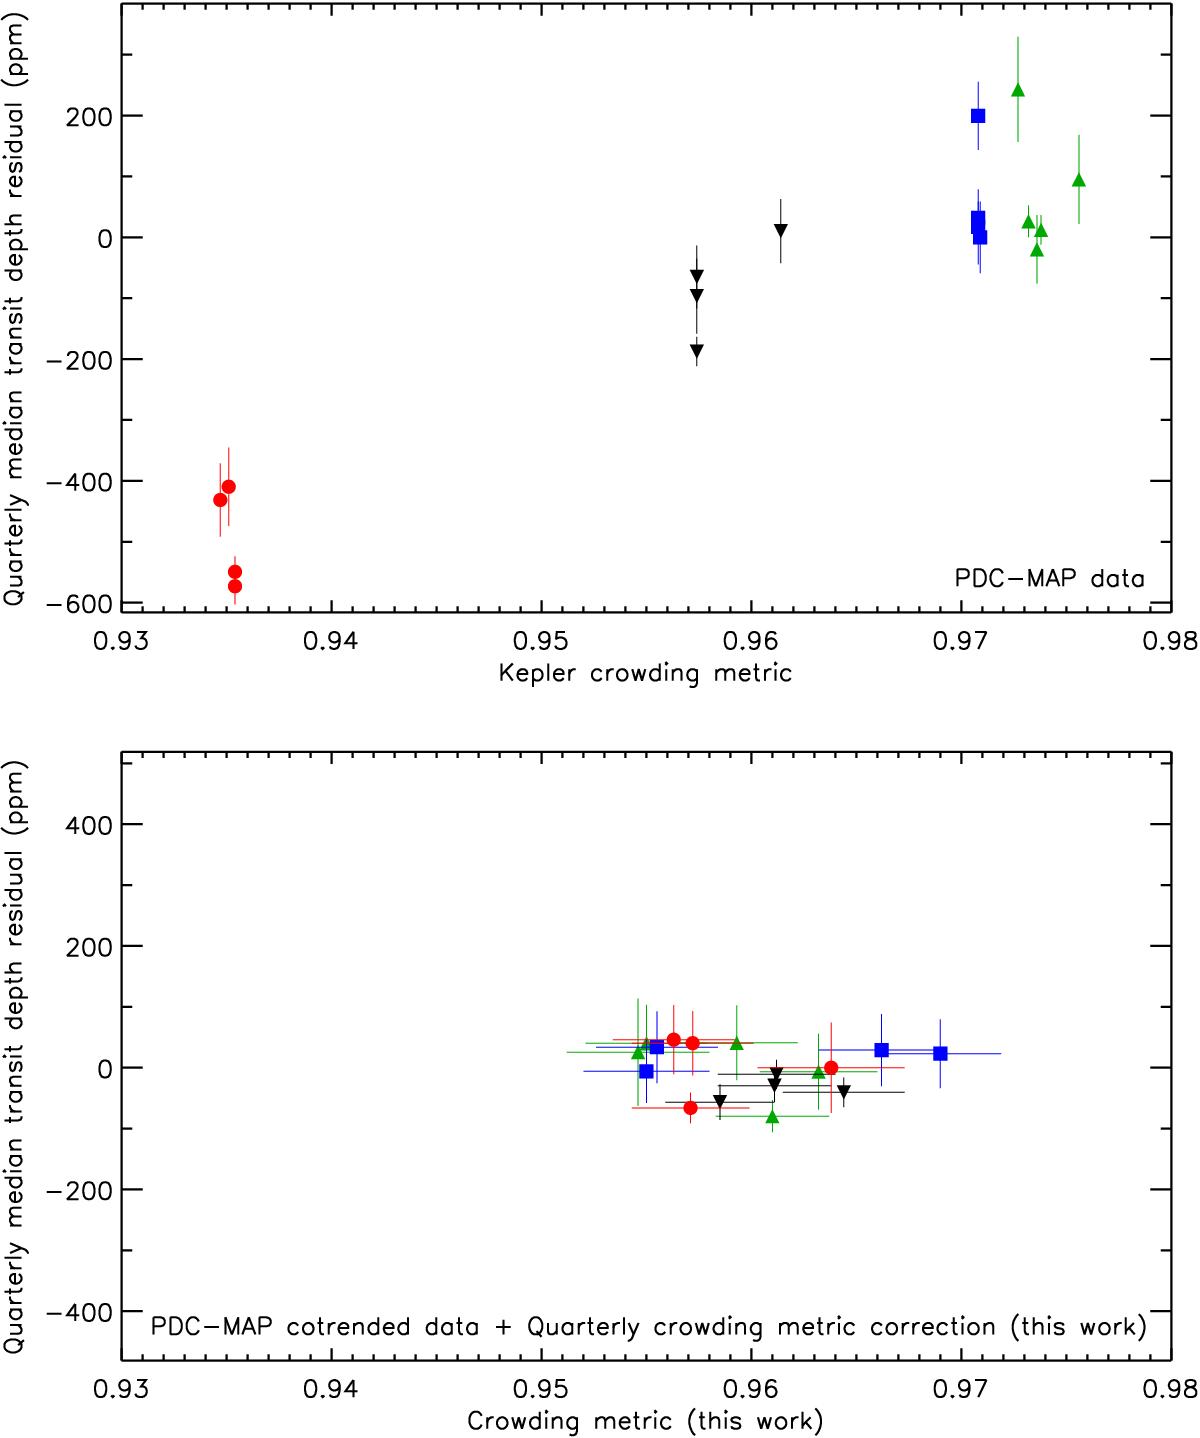
Upper panel: quarterly median transit depth residuals, as derived from the Kepler PDC-MAP light curve of Kepler-423, against Kepler crowding metrics. Error bars are the median absolute deviations. Quarters sharing the same Kepler observing season are plotted with the same symbol and colour: Q1, Q5, Q9, Q13, and Q17 (upward green triangles); Q2, Q6, Q10, and Q14 (downward black triangles); Q3, Q7, Q11, and Q15 (blue squares); Q4, Q8, Q12, and Q16 (red circles). Lower panel: same as before, but for the PDC-MAP cotrended data, following our quarterly crowding metric correction constrained by an informative prior. The x-axis reports our estimates of the quarterly crowding metrics (Table 4).
Current usage metrics show cumulative count of Article Views (full-text article views including HTML views, PDF and ePub downloads, according to the available data) and Abstracts Views on Vision4Press platform.
Data correspond to usage on the plateform after 2015. The current usage metrics is available 48-96 hours after online publication and is updated daily on week days.
Initial download of the metrics may take a while.