Fig. 7
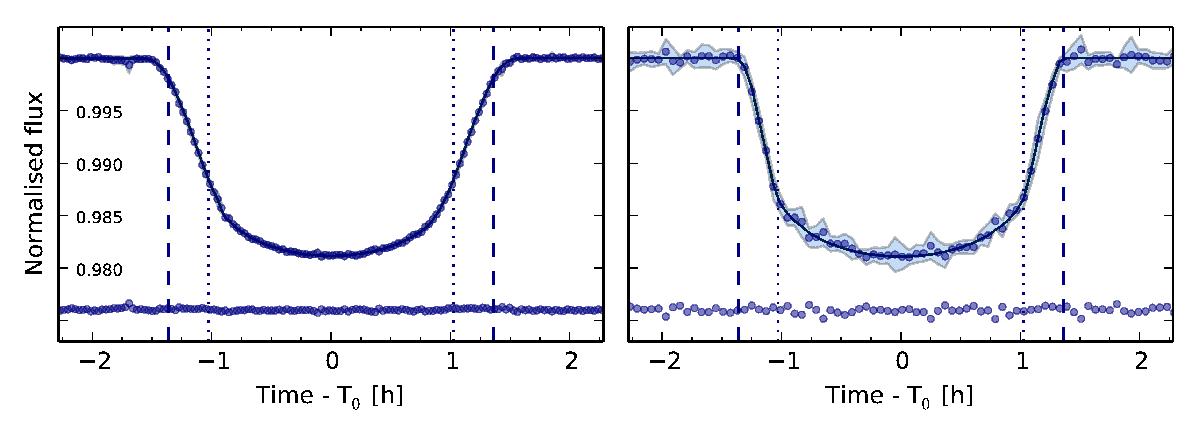
Phase-folded transit light curves of Kepler-423, best fitting model, and residuals. LC data are shown on the left panel, SC on the right panel, both binned at ~1.9 min. The shaded area corresponds to the 3σ errors in the binned fluxes. The dashed lines mark the T14 limits, and the dotted lines the T23 limits. The blurring of the transit shape – due to the long integration time – is obvious in the LC plot (left panel).
Current usage metrics show cumulative count of Article Views (full-text article views including HTML views, PDF and ePub downloads, according to the available data) and Abstracts Views on Vision4Press platform.
Data correspond to usage on the plateform after 2015. The current usage metrics is available 48-96 hours after online publication and is updated daily on week days.
Initial download of the metrics may take a while.