Fig. 1
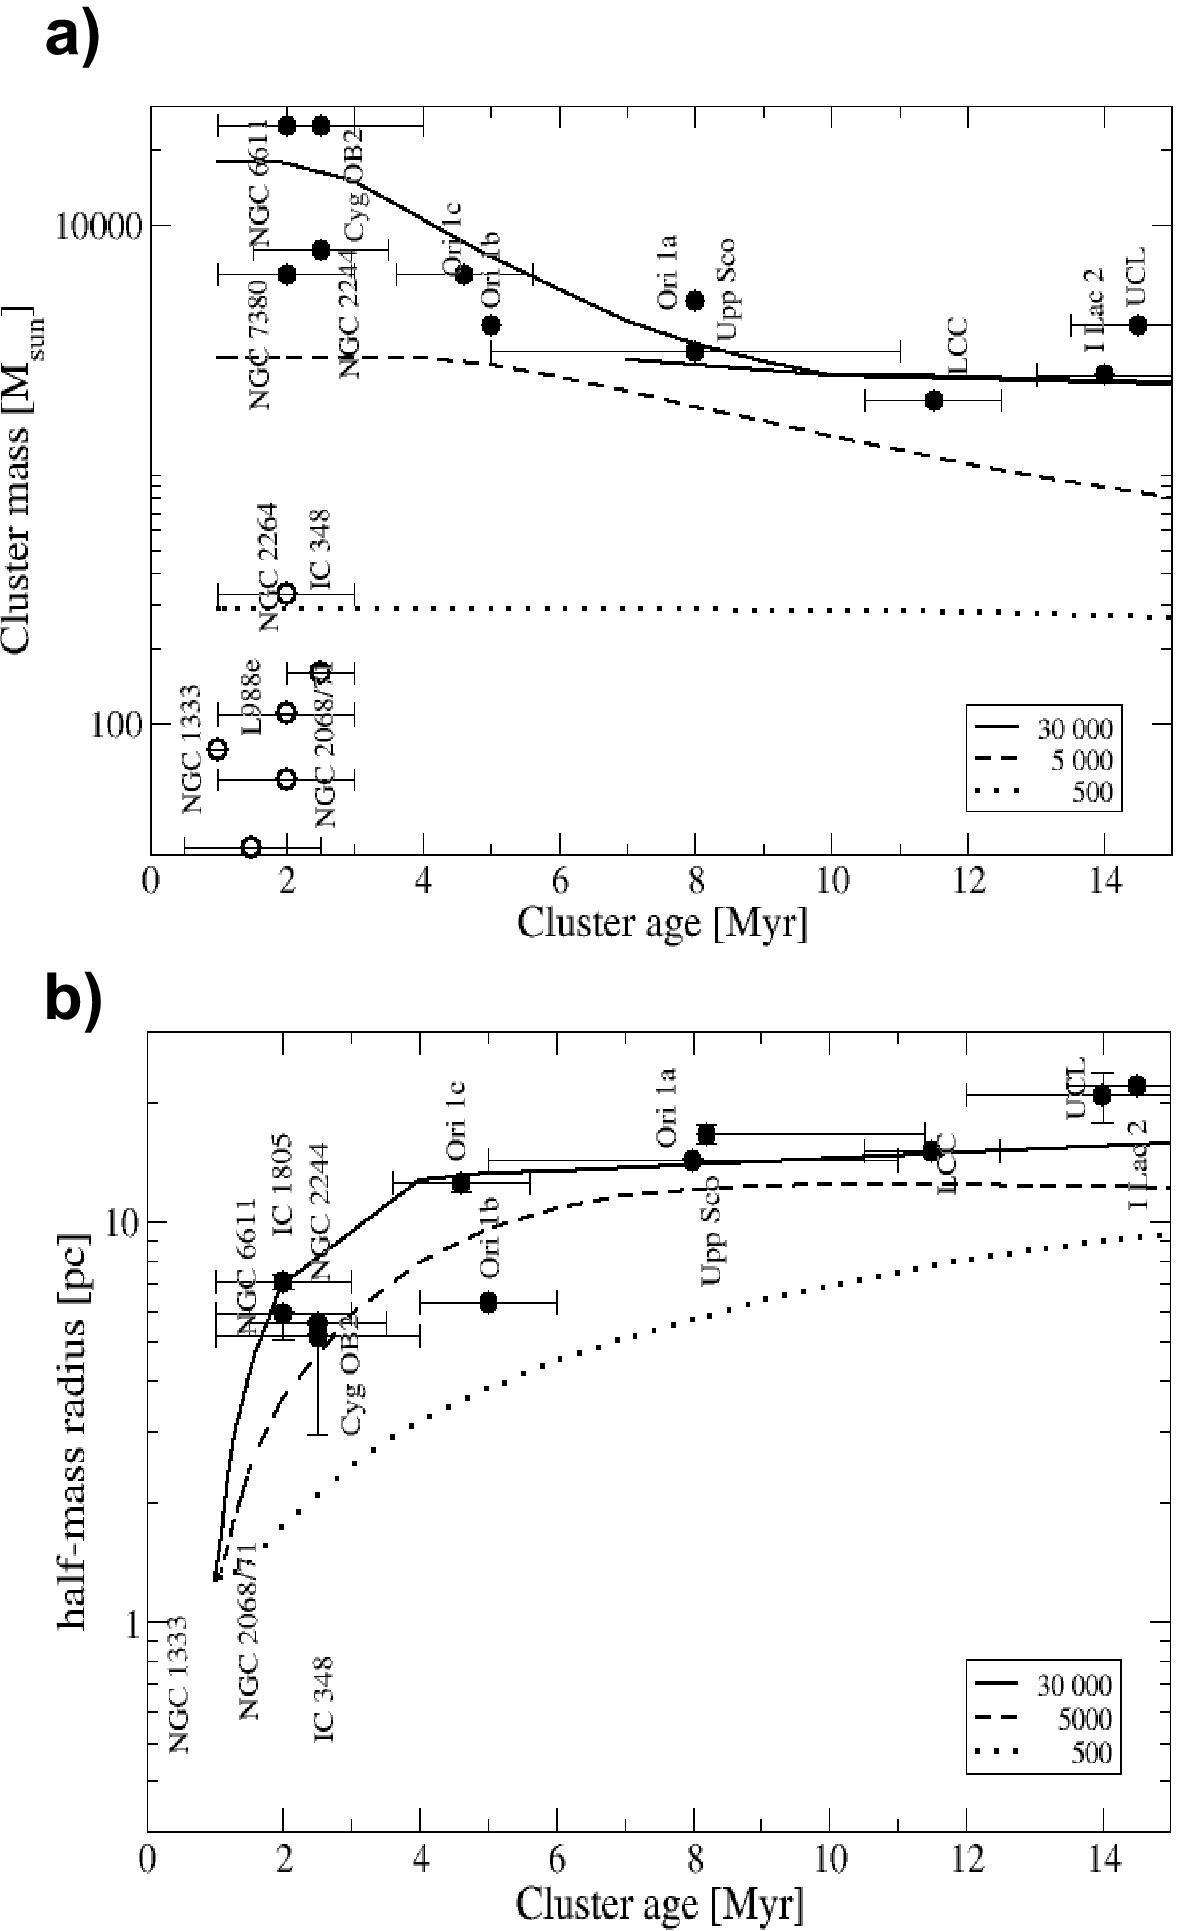
Half-mass radii of the clusters as a function of their age. The open circles indicate clusters still containing large fractions of their natal gas (values from Lada & Lada 2003), whereas the full circles represent clusters that are largely devoid of gas (values from Pfalzner 2009). The solid, dashed, and dotted lines represent our simulation results of the cluster development after gas expulsion for model clusters A1, A3, and A5, respectively.
Current usage metrics show cumulative count of Article Views (full-text article views including HTML views, PDF and ePub downloads, according to the available data) and Abstracts Views on Vision4Press platform.
Data correspond to usage on the plateform after 2015. The current usage metrics is available 48-96 hours after online publication and is updated daily on week days.
Initial download of the metrics may take a while.