Fig. 3
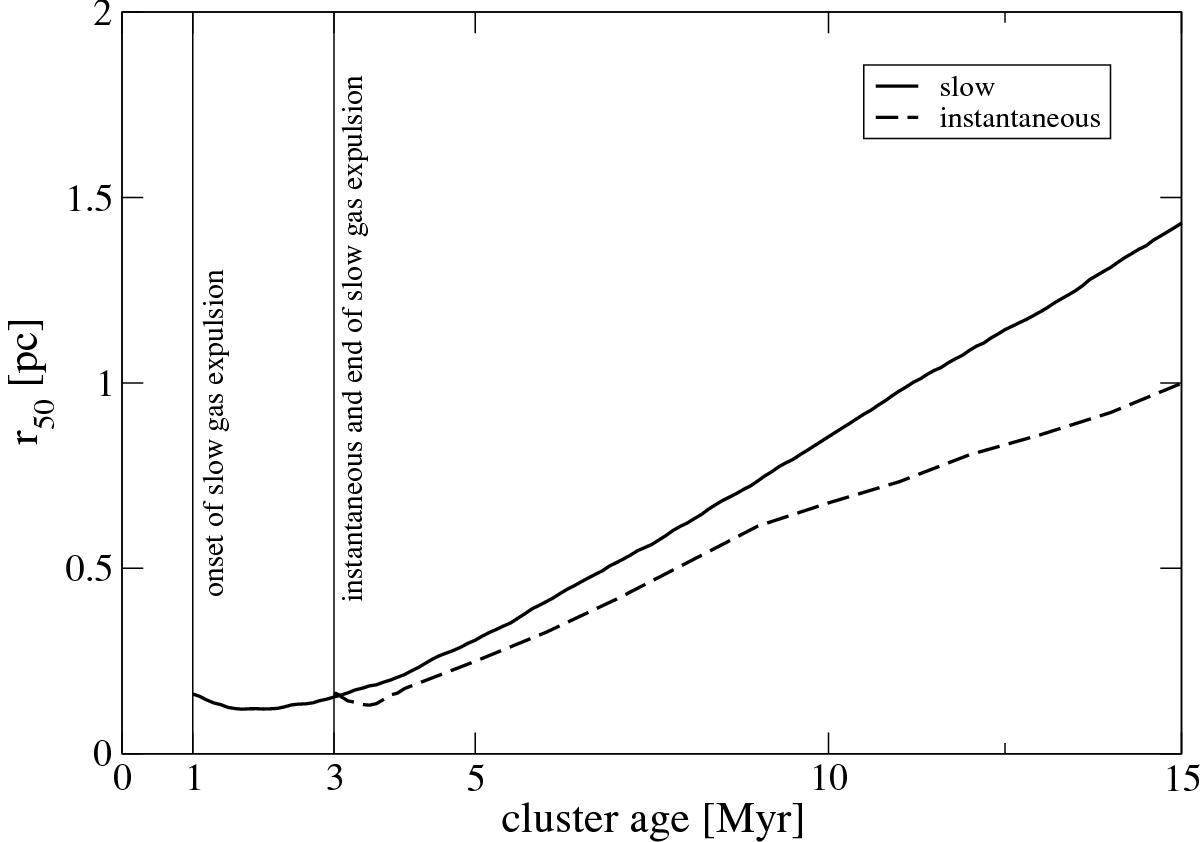
Radius within which the 50 most central stars are contained as a function of cluster age for a cluster that contained 500 stars at the onset of gas expulsion. The solid line shows the case where gas expulsion sets in at 1 Myr and proceeds over the following 2 Myr, whereas the dashed line indicates the case of instantaneous gas expulsion at 3 Myr.
Current usage metrics show cumulative count of Article Views (full-text article views including HTML views, PDF and ePub downloads, according to the available data) and Abstracts Views on Vision4Press platform.
Data correspond to usage on the plateform after 2015. The current usage metrics is available 48-96 hours after online publication and is updated daily on week days.
Initial download of the metrics may take a while.