Fig. 5
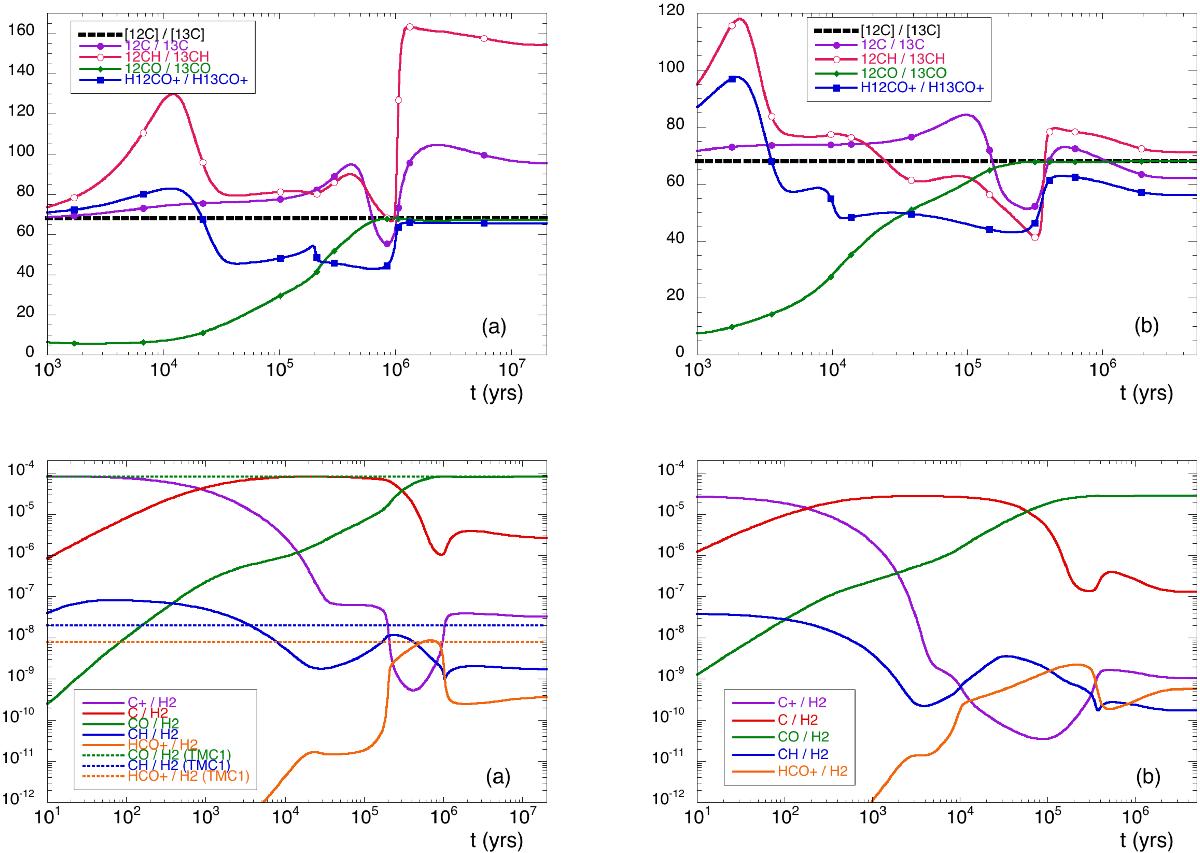
Upper panel: time dependence of C/13C isotopic ratios in C, CH, CO, and HCO+. The black heavy dotted line represents the elemental 12C/13C. Lower panel: time dependence of the fractional abundances relative to H2 of C, 12C+, CO, CH, and HCO+, for models (a) and (b). The observational values towards TMC1 (Ohishi et al. 1992) are displayed as horizontal dashed lines with corresponding colors in the left panel. a) and b) correspond to the models defined in Table 4.
Current usage metrics show cumulative count of Article Views (full-text article views including HTML views, PDF and ePub downloads, according to the available data) and Abstracts Views on Vision4Press platform.
Data correspond to usage on the plateform after 2015. The current usage metrics is available 48-96 hours after online publication and is updated daily on week days.
Initial download of the metrics may take a while.