Fig. 1
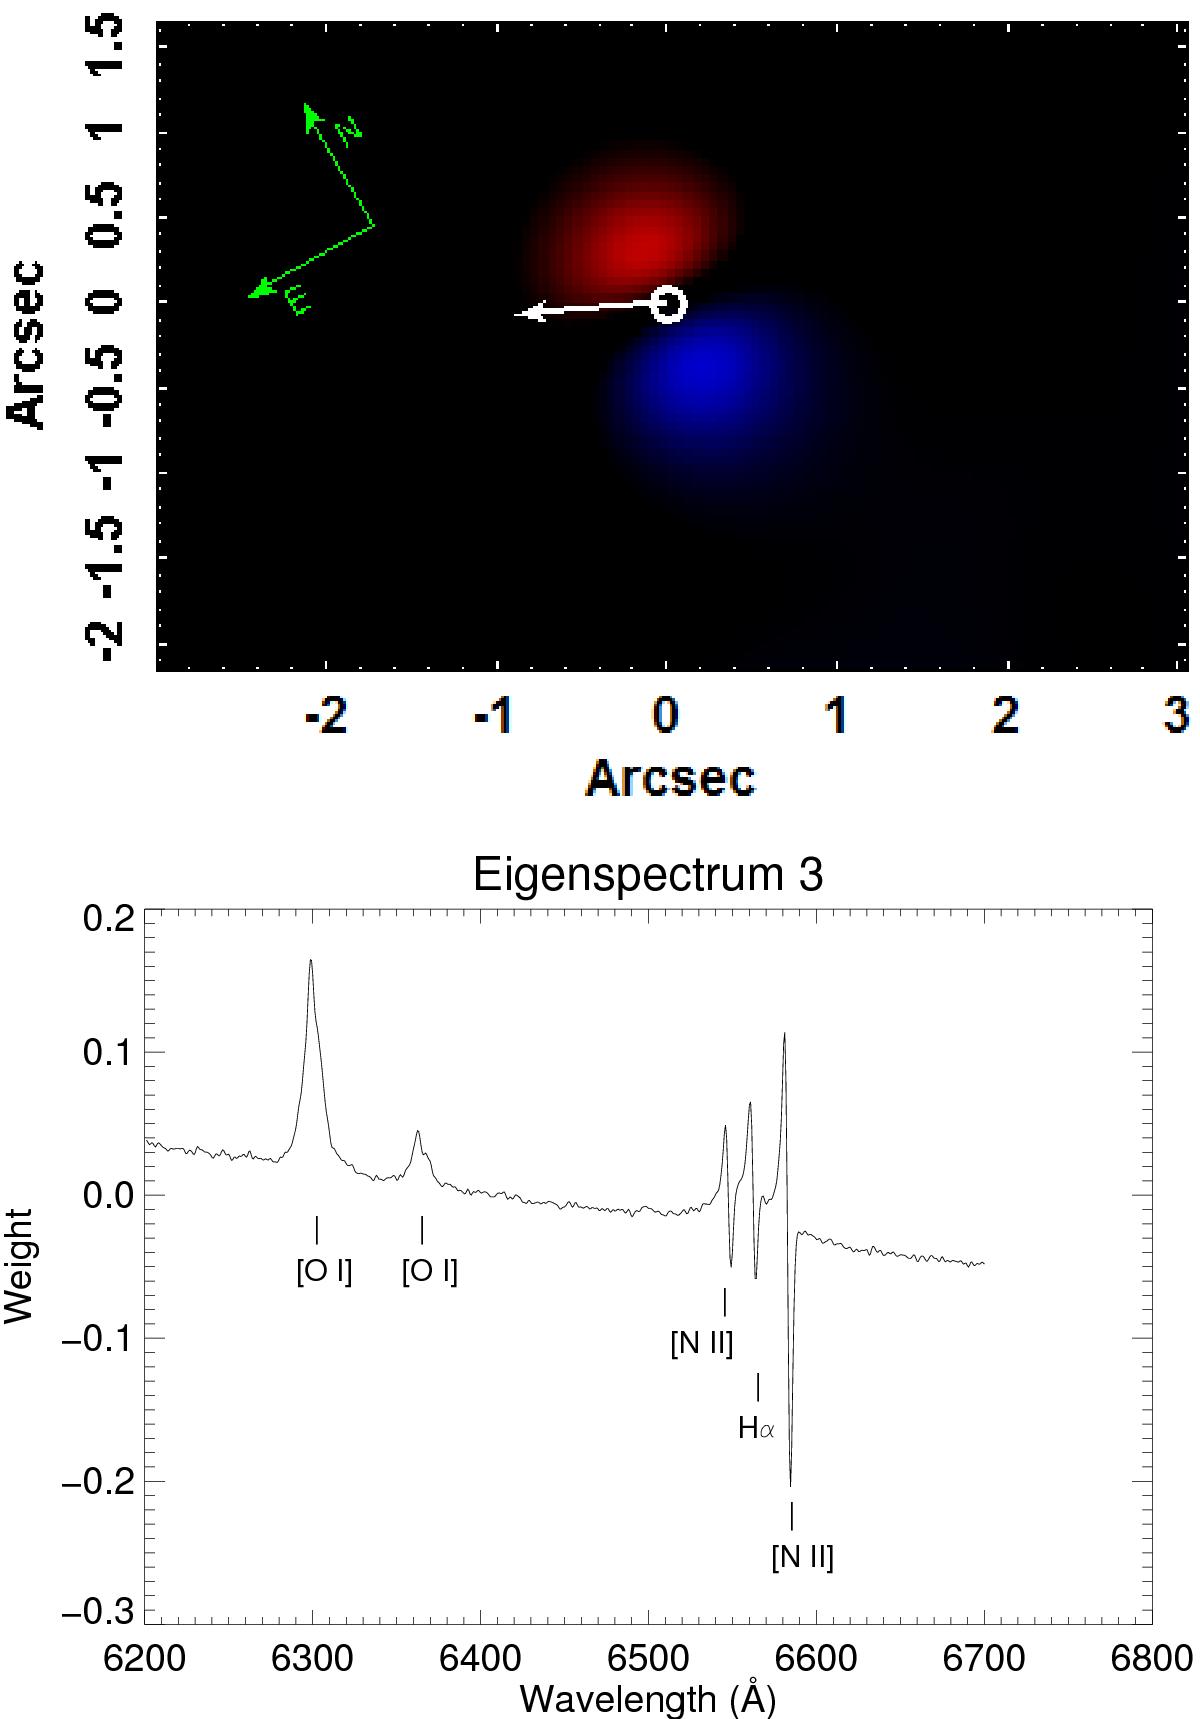
Tomogram and eigenspectrum 3 of the PCA tomography applied to the 6200−6700 Å spectral range. The anti-correlation between the red and the blue wings of the [N II] and Hα emission lines associated with a bipolar structure seen in the tomogram is a typical signature of gas kinematics. In the tomogram, the structure in blue (red) corresponds to the blue (red) wings of the [N II] and Hα emission lines. In this case, we interpreted this kinematics as a gas disc with PA = −3° ± 1°. The white circle marks the position of the AGN as given by the image of the broad component of Hα, and the white arrow corresponds to the direction of a resolved nuclear radio jet with PA = 65° (Martí-Vidal et al. 2011).
Current usage metrics show cumulative count of Article Views (full-text article views including HTML views, PDF and ePub downloads, according to the available data) and Abstracts Views on Vision4Press platform.
Data correspond to usage on the plateform after 2015. The current usage metrics is available 48-96 hours after online publication and is updated daily on week days.
Initial download of the metrics may take a while.