Free Access
Fig. 3
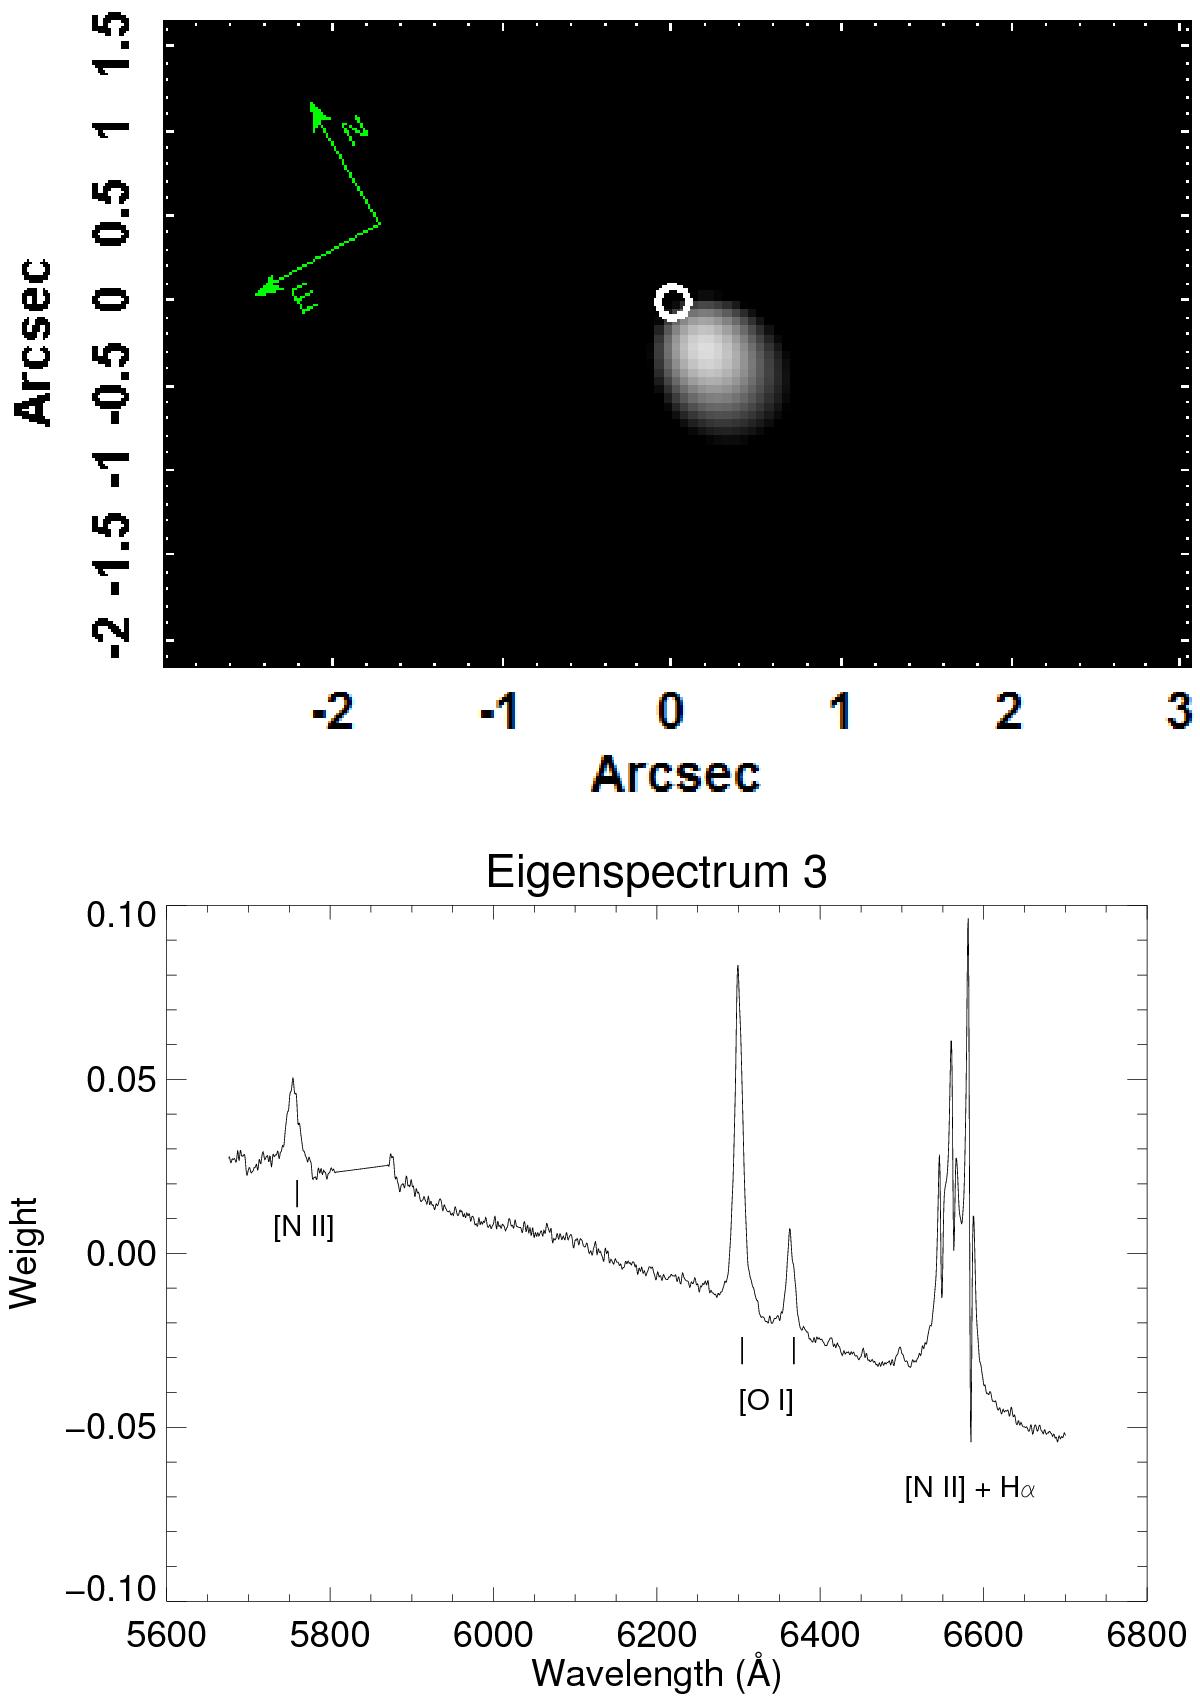
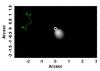
Tomogram and eigenspectrum 3 of the PCA tomography applied to the 5675−6700 Å spectral range. This range includes the [N II]λ5755 emission line, which is sensitive to the high temperatures of the ionized gas. The eigenvector reveals a correlation between all emission lines and the blue component of the continuum.
This figure is made of several images, please see below:
Current usage metrics show cumulative count of Article Views (full-text article views including HTML views, PDF and ePub downloads, according to the available data) and Abstracts Views on Vision4Press platform.
Data correspond to usage on the plateform after 2015. The current usage metrics is available 48-96 hours after online publication and is updated daily on week days.
Initial download of the metrics may take a while.