Free Access
Fig. 2
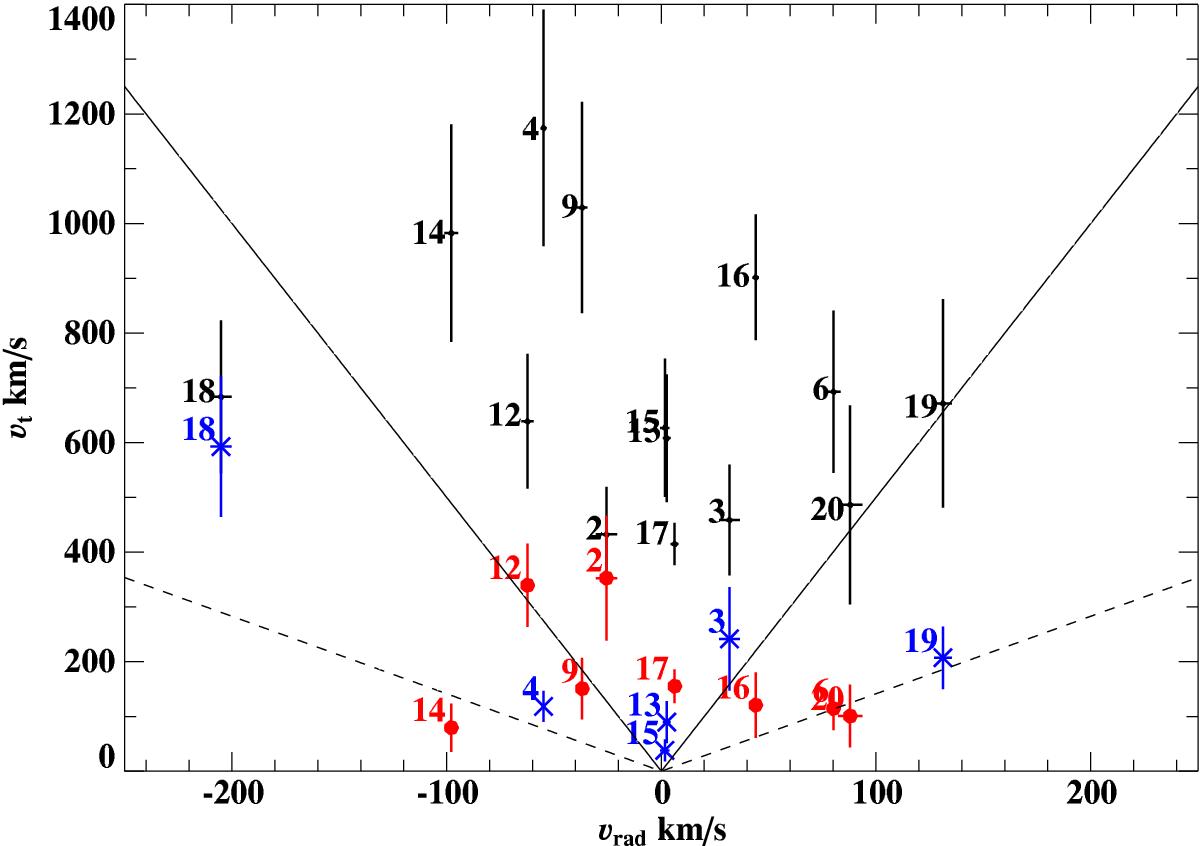
Comparison of the tangential and radial velocity derived in this work (coloured with error bars, red dots indicate stars with [Fe/H] > − 0.7, blue crosses [Fe/H] < − 0.7) and P14 (black). Error bars of P14 were derived in the same way as in this work. The dashed lines indicate ![]() , while the solid lines indicate νt = 5νr.
, while the solid lines indicate νt = 5νr.
Current usage metrics show cumulative count of Article Views (full-text article views including HTML views, PDF and ePub downloads, according to the available data) and Abstracts Views on Vision4Press platform.
Data correspond to usage on the plateform after 2015. The current usage metrics is available 48-96 hours after online publication and is updated daily on week days.
Initial download of the metrics may take a while.