Fig. 5
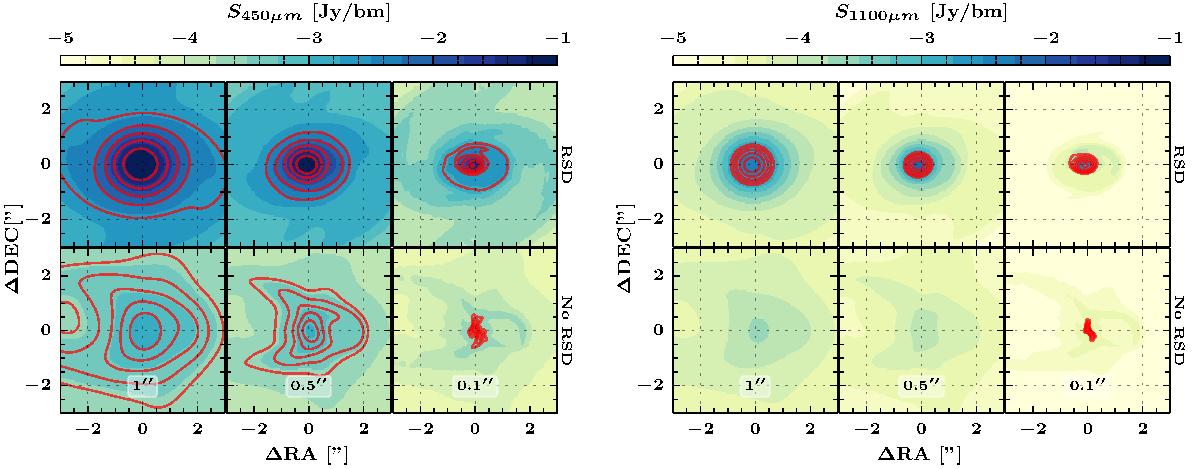
Convolved continuum maps in the inner 5″ of 450 (left) and 1100 (right) μm at i = 45°. The images are convolved with 1″, 0.5″, and 0.1″ beams as indicated in each panel. For each panel, the top row shows synthetic image of RSD simulation and the pseudo-disk simulation is shown in the bottom row. The color scale presents the full range of the emission above 10-2 mJy/bm, not all of which may be detectable. Solid red contours are drawn from 3σ up to maximum at 6 logarithmic steps where 1σ is 0.01 × the maximum (dynamical range of 100) with a minimum at 0.5 mJy/bm for the 1″ and 0.5″ images. For the images convolved with a 0.1″ beam, the red contours are drawn with a minimum noise level of 0.5 mJy/bm for 450 μm and 0.05 mJy/bm at longer wavelengths with a dynamic range of 1000, as appropriate for the full ALMA.
Current usage metrics show cumulative count of Article Views (full-text article views including HTML views, PDF and ePub downloads, according to the available data) and Abstracts Views on Vision4Press platform.
Data correspond to usage on the plateform after 2015. The current usage metrics is available 48-96 hours after online publication and is updated daily on week days.
Initial download of the metrics may take a while.