Fig. 10
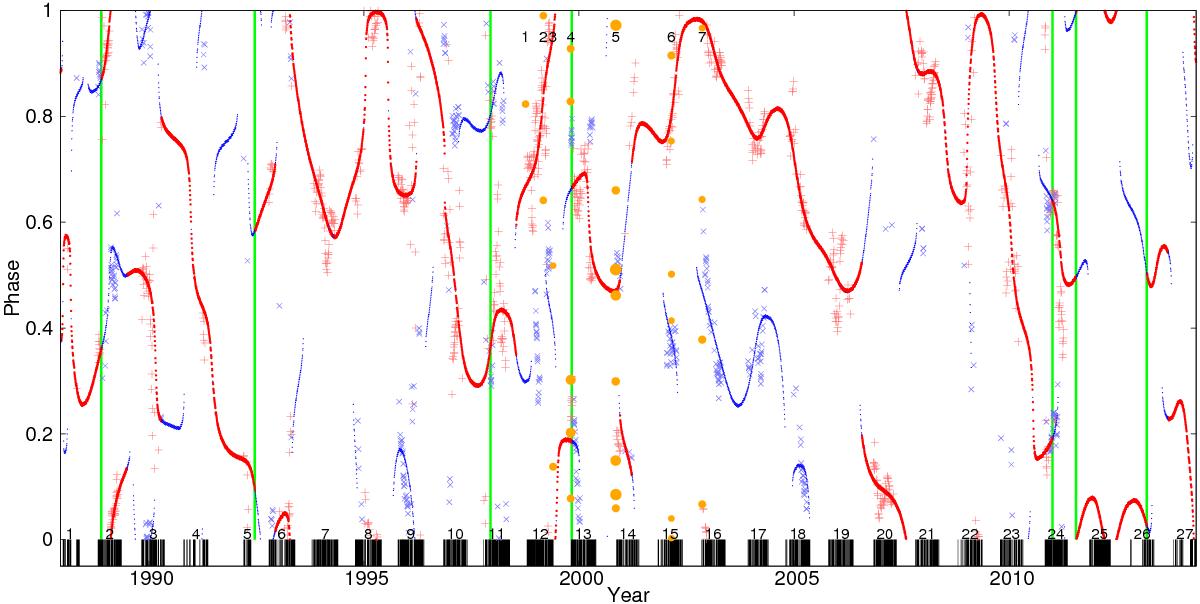
Phases of the minima for period ![]() . Red dots: primary minima from CF; red pluses: primary minima from CPS; blue points: secondary minima from CF; blue crosses: secondary minima from CPS; orange circles: minima from DI; and bold green vertical lines denote the epochs of possible flip-flop events. The black bars with the numbers correspond to the photometric observing seasons, the numbers on top of the figure mark the observing seasons of DI.
. Red dots: primary minima from CF; red pluses: primary minima from CPS; blue points: secondary minima from CF; blue crosses: secondary minima from CPS; orange circles: minima from DI; and bold green vertical lines denote the epochs of possible flip-flop events. The black bars with the numbers correspond to the photometric observing seasons, the numbers on top of the figure mark the observing seasons of DI.
Current usage metrics show cumulative count of Article Views (full-text article views including HTML views, PDF and ePub downloads, according to the available data) and Abstracts Views on Vision4Press platform.
Data correspond to usage on the plateform after 2015. The current usage metrics is available 48-96 hours after online publication and is updated daily on week days.
Initial download of the metrics may take a while.