Fig. 10
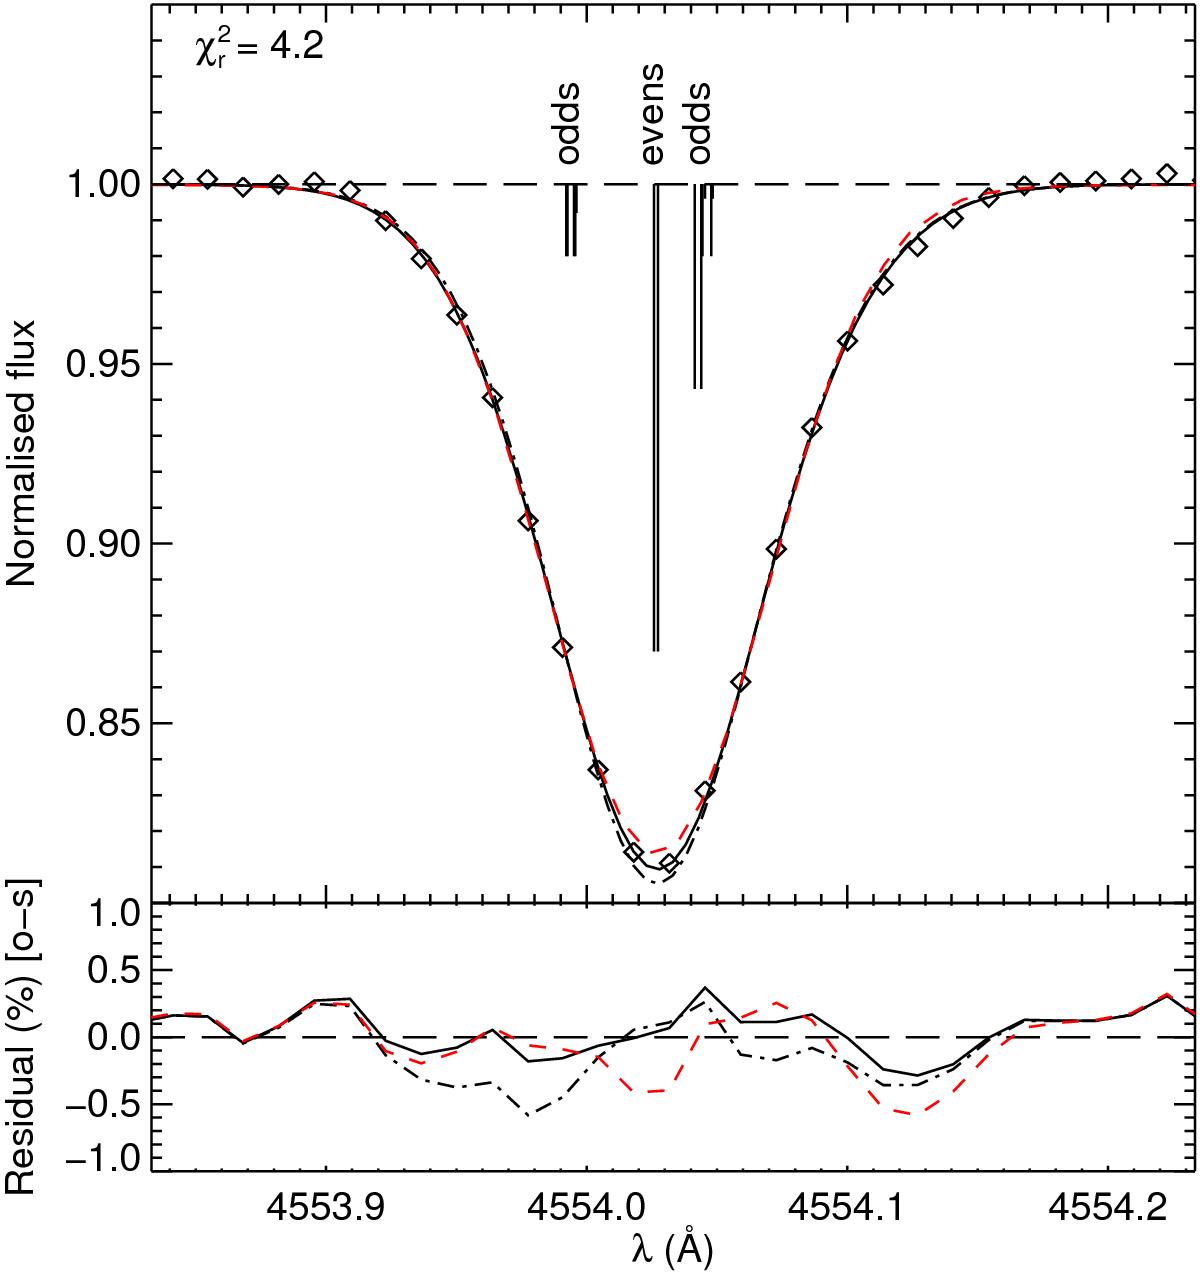
Best fit 3D (solid black line – fodd = 0.38) and 1D (dashed red line – fodd = 0.02 from Paper I) fits to the observed Ba ii 4554 Å profile (black diamonds). A residual plot is presented in the bottom panel. We have also included a lower isotope ratio fit to the observed profile (dashed-dot line) for fodd = 0.25, i.e. 40%, for the same υsini and A(Ba) values used in the best fit.
Current usage metrics show cumulative count of Article Views (full-text article views including HTML views, PDF and ePub downloads, according to the available data) and Abstracts Views on Vision4Press platform.
Data correspond to usage on the plateform after 2015. The current usage metrics is available 48-96 hours after online publication and is updated daily on week days.
Initial download of the metrics may take a while.