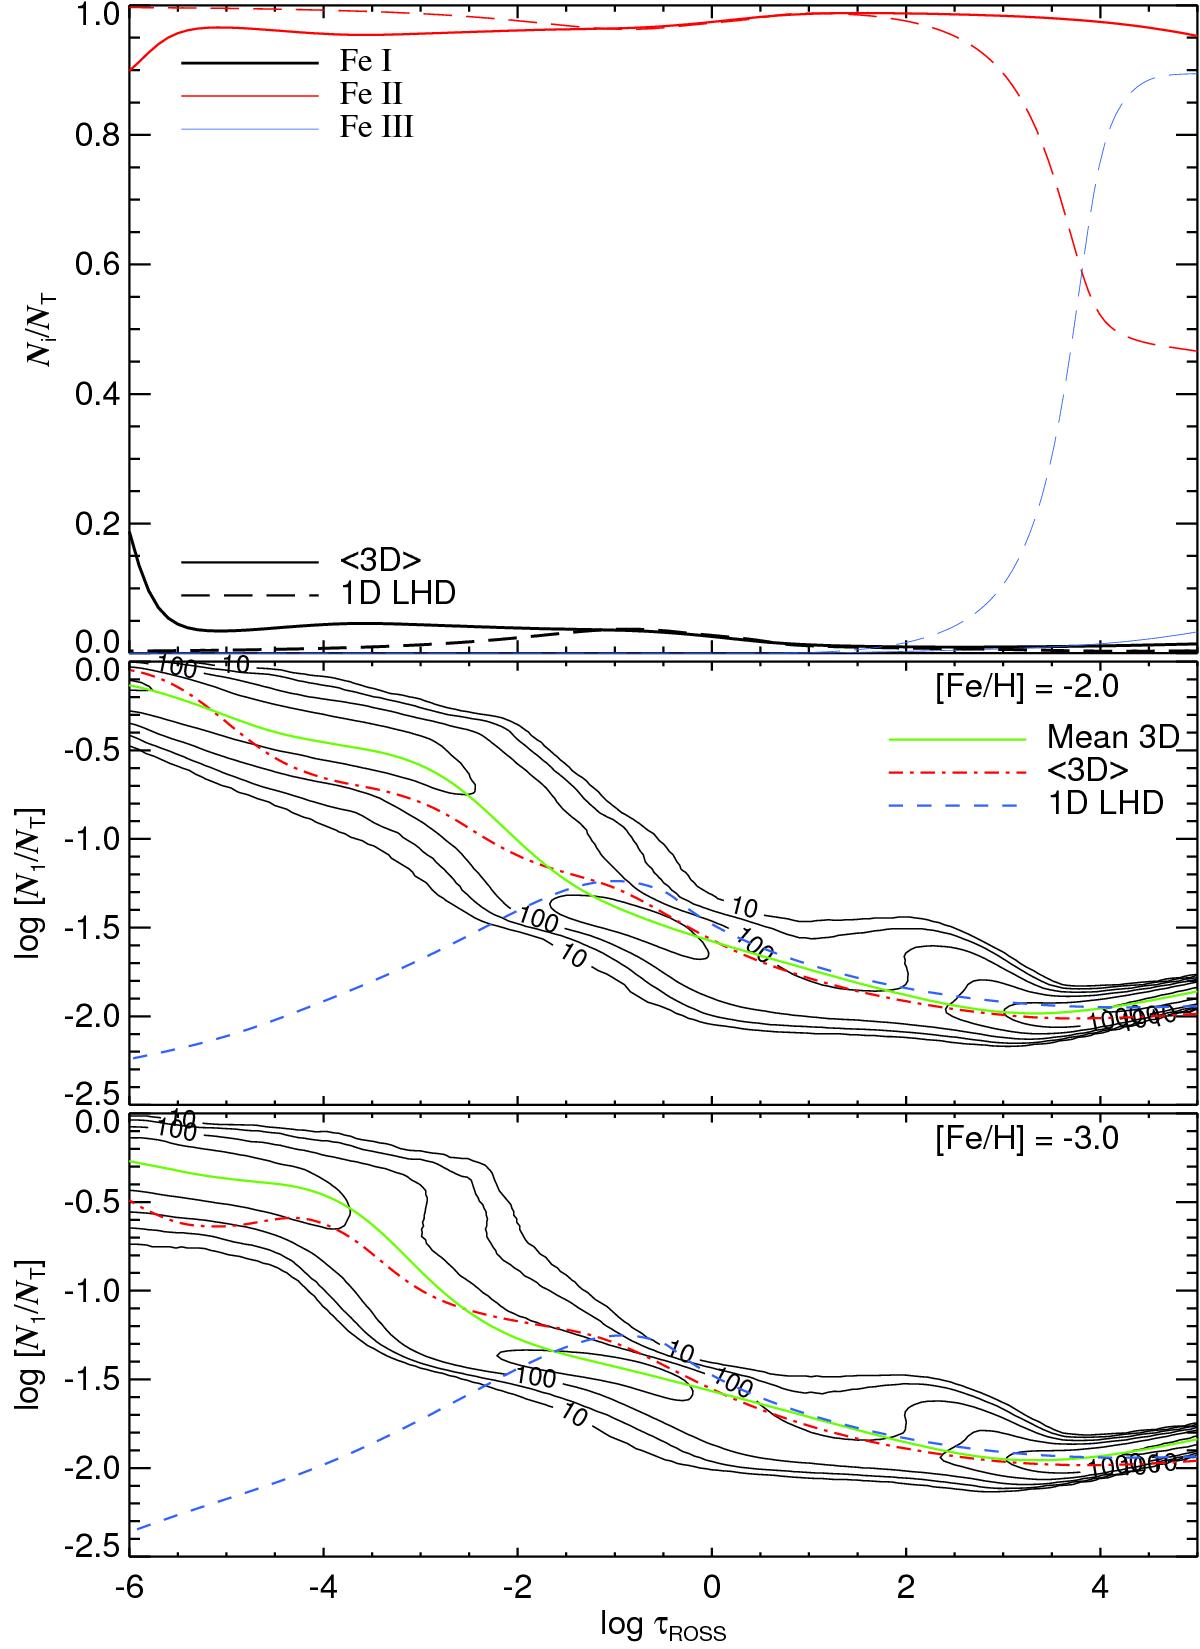
Fig. 3
Top panel: comparisons of the ⟨3D⟩ (solid lines) and 1D (dashed lines) atmosphere’s ionisation fractions for the neutral and first two ionisation levels of iron. The [Fe/H] = −2.0 and −3.0⟨3D⟩ atmospheres have been interpolated to produce this plot. Middle panel: ionisation fraction of Fe i for the full 3D (contour) atmosphere for 10 snapshots of the [Fe/H] = −2.0 atmosphere. Contour values represent non-normalised frequencies. Also included are the equivalent ⟨3D⟩ (dash-dot), average 3D (solid line) and 1D LHD (dashed line) ionisation fraction of Fe i. Bottom panel: same as middle panel for the [Fe/H] = −3.0 atmosphere. All ionisation fractions presented in the figure were calculated under the assumption of LTE.
Current usage metrics show cumulative count of Article Views (full-text article views including HTML views, PDF and ePub downloads, according to the available data) and Abstracts Views on Vision4Press platform.
Data correspond to usage on the plateform after 2015. The current usage metrics is available 48-96 hours after online publication and is updated daily on week days.
Initial download of the metrics may take a while.