Fig. 5
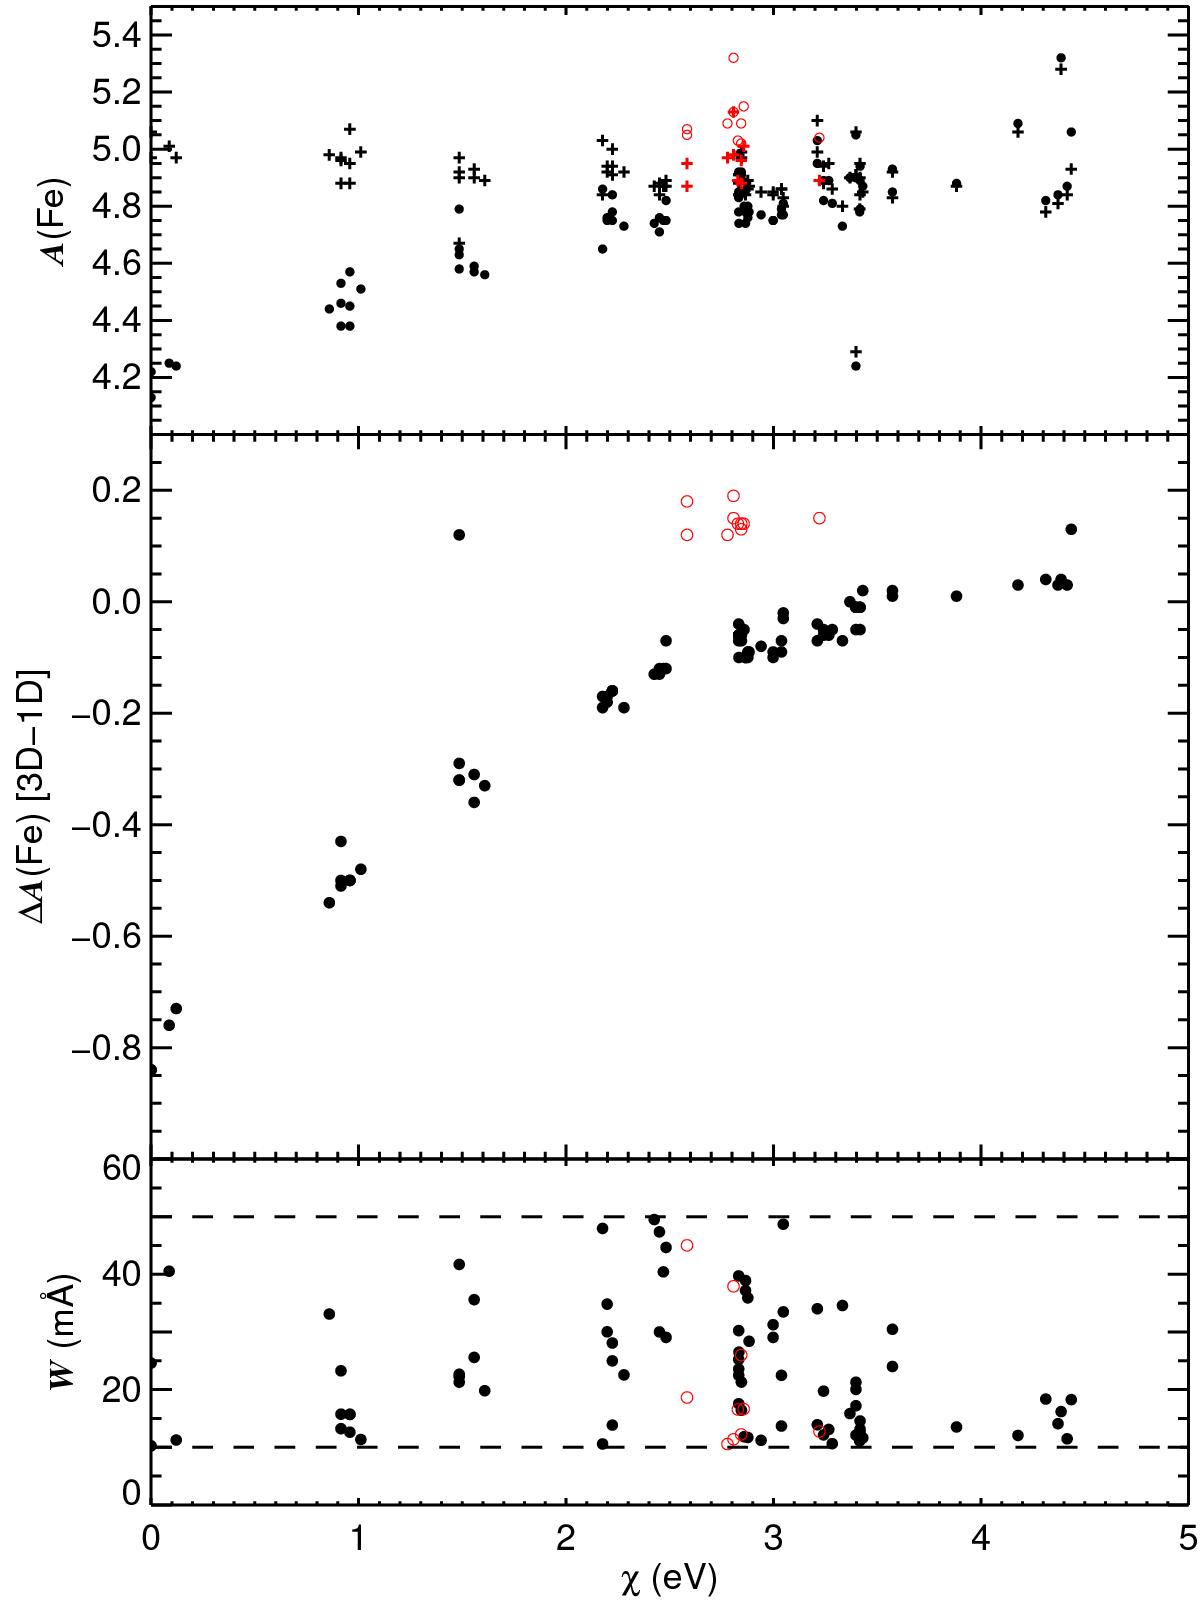
Top panel: 3D (filled circles) and 1D (crosses) abundances for the 91 iron lines analysed under LTE. Red open circles and red crosses represent the Fe ii lines for the 3D and 1D synthesis, respectively. While the 1D abundances remain fairly consistent for varying excitation potential, the 3D results show a reduction in abundance at low excitation potentials. Middle panel: apparent excitation potential dependence shown by the Fe i lines (filled circles), emphasised by plotting the difference between 3D and 1D abundances. The Fe ii lines (red open circles) are not affected by this trend. The clear Fe i outlier seen at ~1.5 eV is caused by a poor fit to the iron line under the 1D paradigm from Paper I. Bottom panel: scatter in line strength with excitation potential for the Fe i (filled circles) and Fe ii (red open circles). This also shows that there is no line strength dependence on excitation potential and thus the abundance difference in the middle panel is purely an effect of excitation potential.
Current usage metrics show cumulative count of Article Views (full-text article views including HTML views, PDF and ePub downloads, according to the available data) and Abstracts Views on Vision4Press platform.
Data correspond to usage on the plateform after 2015. The current usage metrics is available 48-96 hours after online publication and is updated daily on week days.
Initial download of the metrics may take a while.