Fig. 8
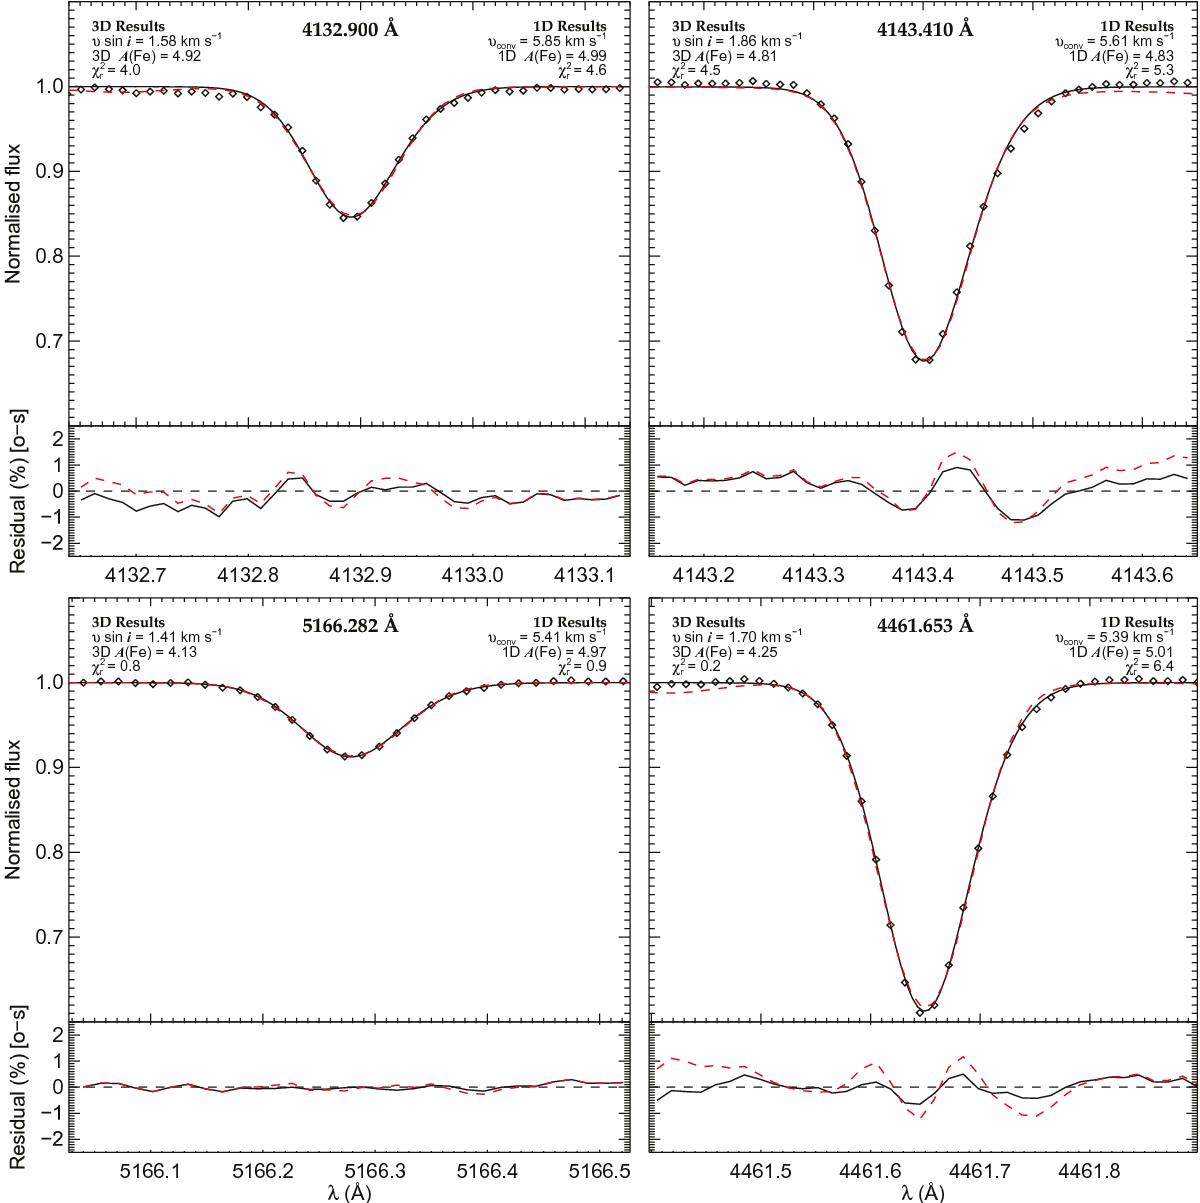
Best fit 3D (solid black lines) and 1D (red dashed lines) line profiles compared to the observations (diamonds) for the four Fe i lines listed in Table 2. A residual plot is shown below each line profile. The same ordering has been used for the plots in this figure as in Fig. 7, i.e. top panels are the high excitation lines and the bottom panels are the high excitation lines.
Current usage metrics show cumulative count of Article Views (full-text article views including HTML views, PDF and ePub downloads, according to the available data) and Abstracts Views on Vision4Press platform.
Data correspond to usage on the plateform after 2015. The current usage metrics is available 48-96 hours after online publication and is updated daily on week days.
Initial download of the metrics may take a while.