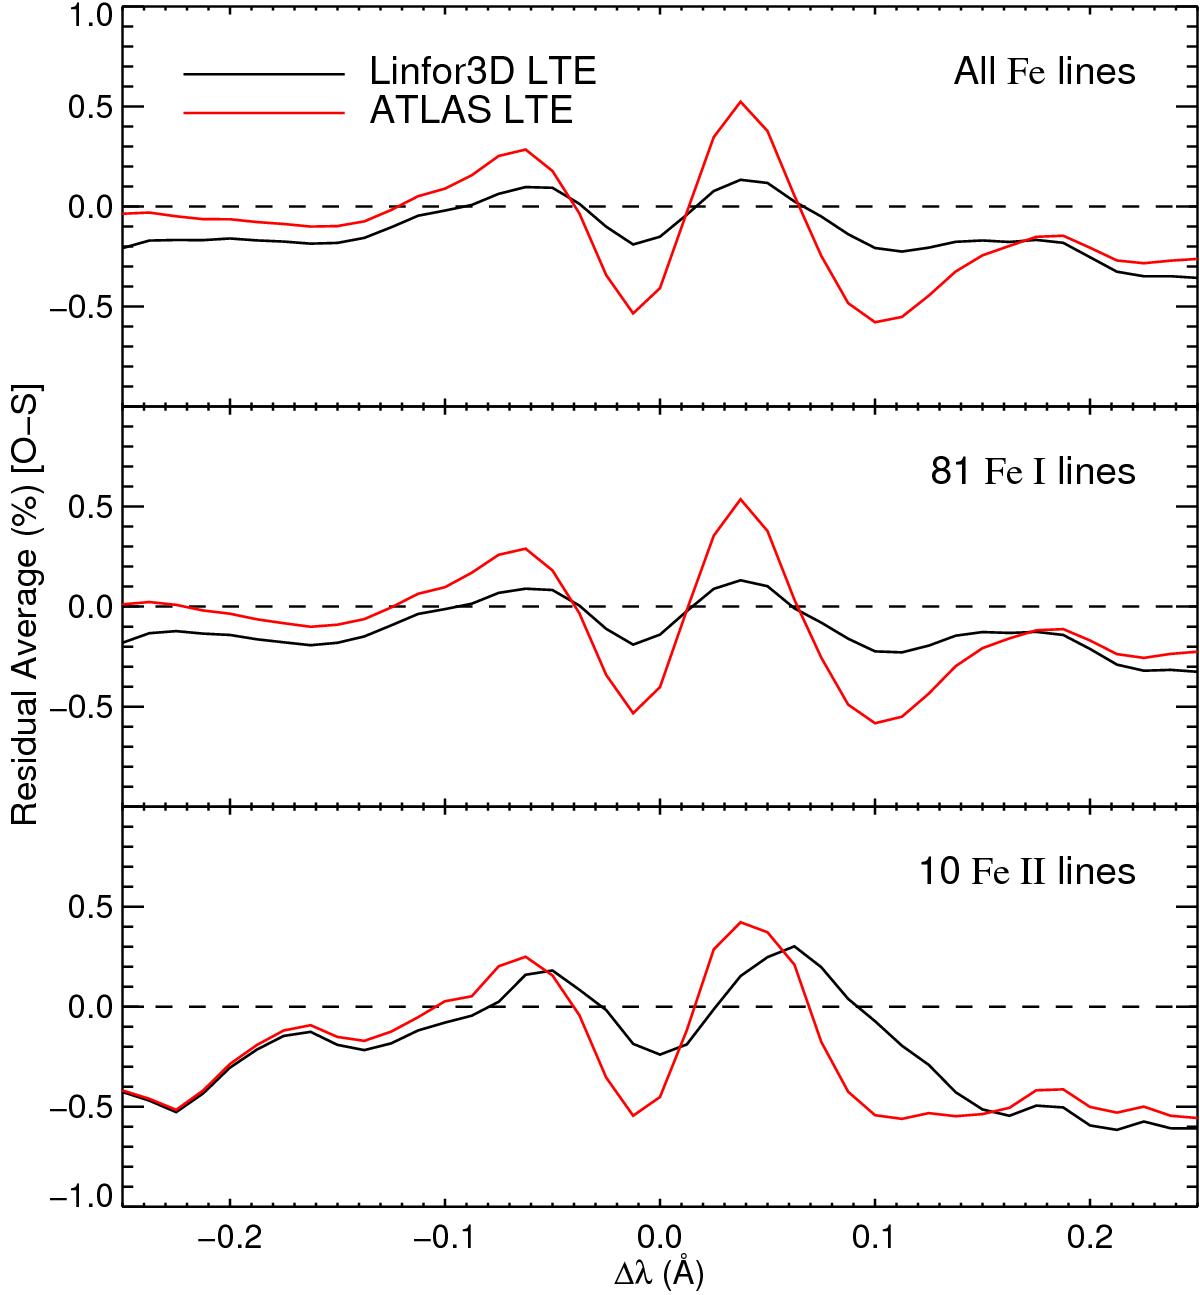
Fig. 9

Reduced noise residual plot for all 91 iron lines (top panel), 81 Fe i lines (middle panel) and 10 Fe ii lines (bottom panel) for the 1D (red line) and 3D (black line) analyses. Notable improvements can be seen in both the line core and red wing asymmetries under the 3D analysis, which are seen clearly in the 1D analysis. Small differences between the Fe i and complete iron line sample exist but notable differences between the Fe ii and the Fe i lines can be seen. However, this is most likely a result of the number of lines in each sample.
Current usage metrics show cumulative count of Article Views (full-text article views including HTML views, PDF and ePub downloads, according to the available data) and Abstracts Views on Vision4Press platform.
Data correspond to usage on the plateform after 2015. The current usage metrics is available 48-96 hours after online publication and is updated daily on week days.
Initial download of the metrics may take a while.


