Fig. 1
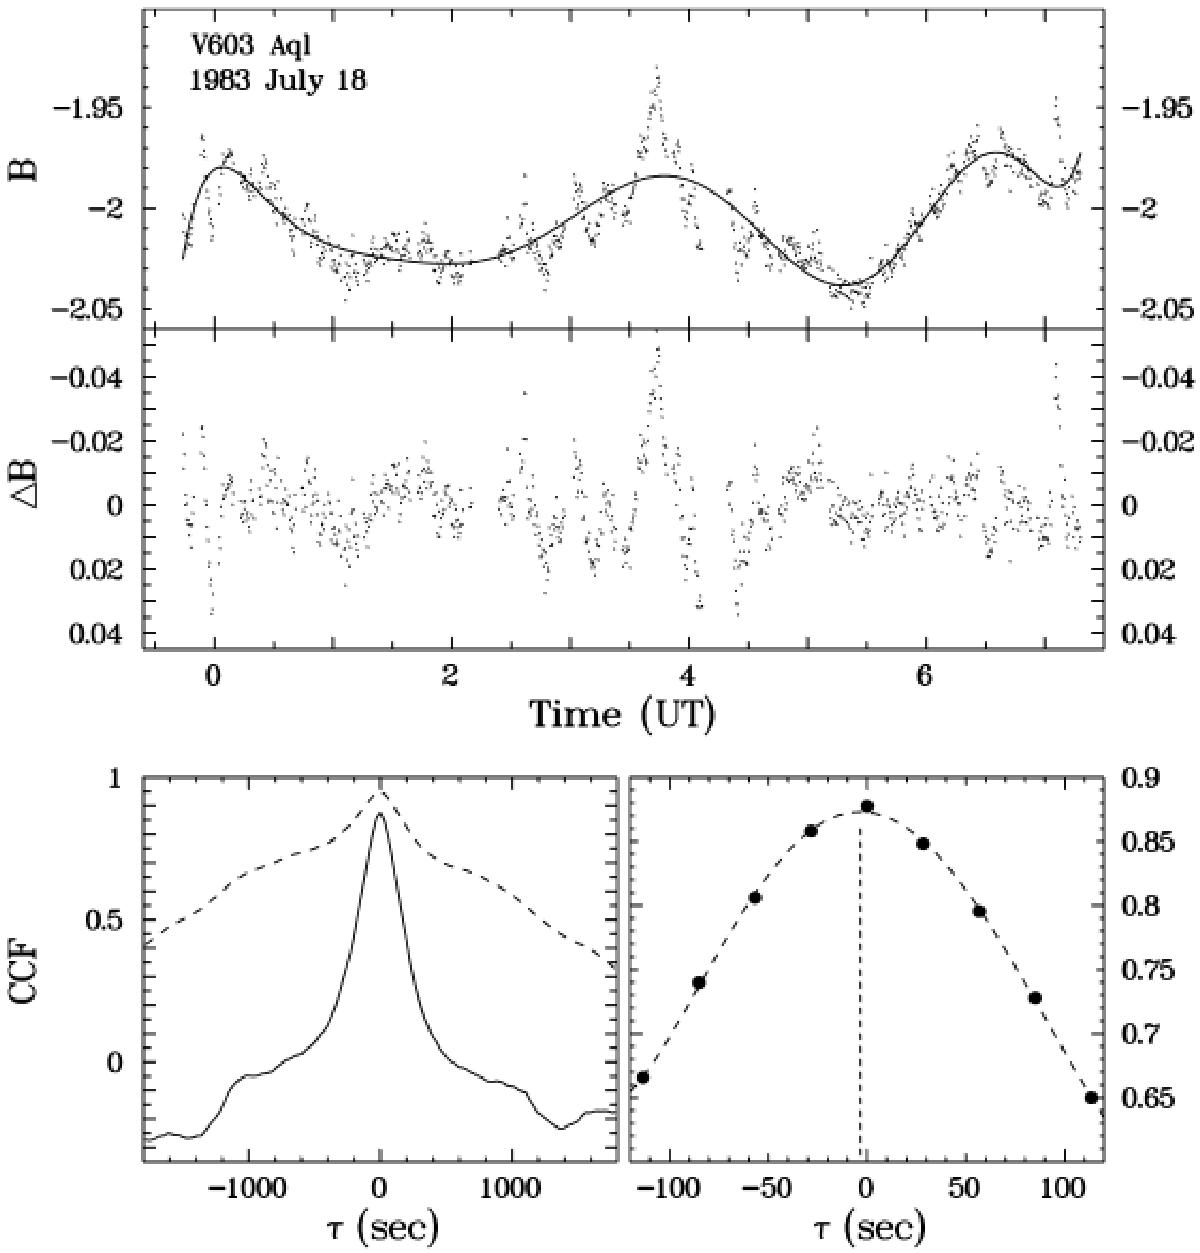
Example of a light curve and the CCF of the brightness variations in two photometric bands. Top: B band light curve of V603 Aql observed on 1983 July 18. The solid line is a fit of a high-order polynomial to the data. Centre: residuals between the original light curve and the polynomial fit. Bottom left: CCF of the light curve shown in the top panel with the simultaneously observed light curve in the U band (broken line) and of the residuals between the original data and the polynomial fit (solid line). Bottom right: enlarged section of the maximum of the CCF shown as a solid line in the lower left panel (dots) together with a fit of a high-order polynomial to the data (broken curve). The broken vertical line indicates the location of the maximum of the fitted polynomial.
Current usage metrics show cumulative count of Article Views (full-text article views including HTML views, PDF and ePub downloads, according to the available data) and Abstracts Views on Vision4Press platform.
Data correspond to usage on the plateform after 2015. The current usage metrics is available 48-96 hours after online publication and is updated daily on week days.
Initial download of the metrics may take a while.