Fig. 5
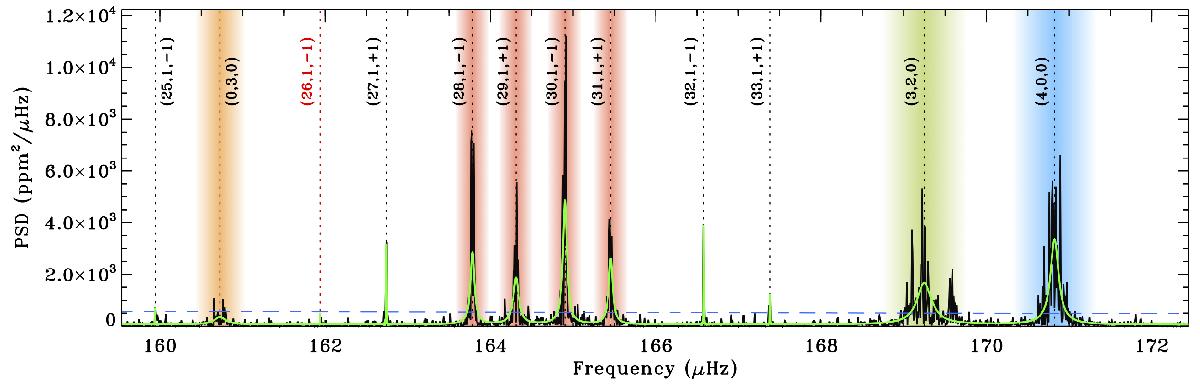
Example of a fit chunk for KIC 12008916 derived by Diamonds. The PSD is shown in black, while the resulting fit using the parameters listed in Tables B.37 and B.38 is indicated by a green solid line. The level of eight times the background is shown with a blue dashed line as a reference for the peak significance. The colored vertical bands highlight the oscillation modes modeled by a Lorentzian profile, Eq. (5), with ℓ = 0 in blue, ℓ = 2 in green, ℓ = 3 in orange, and ℓ = 1 mixed modes in red. The vertical dotted lines mark the central frequency ν0 for each of the fit modes, with the corresponding mode identification (Peak #, ℓ, m) also labeled, according to the description given in Appendix B. The case of the unresolved mixed mode (26,1, −1) is shown in red because the peak has a detection probability (pB = 0.002) below the threshold suggested in Sect. 2.3.
Current usage metrics show cumulative count of Article Views (full-text article views including HTML views, PDF and ePub downloads, according to the available data) and Abstracts Views on Vision4Press platform.
Data correspond to usage on the plateform after 2015. The current usage metrics is available 48-96 hours after online publication and is updated daily on week days.
Initial download of the metrics may take a while.