Fig. 2
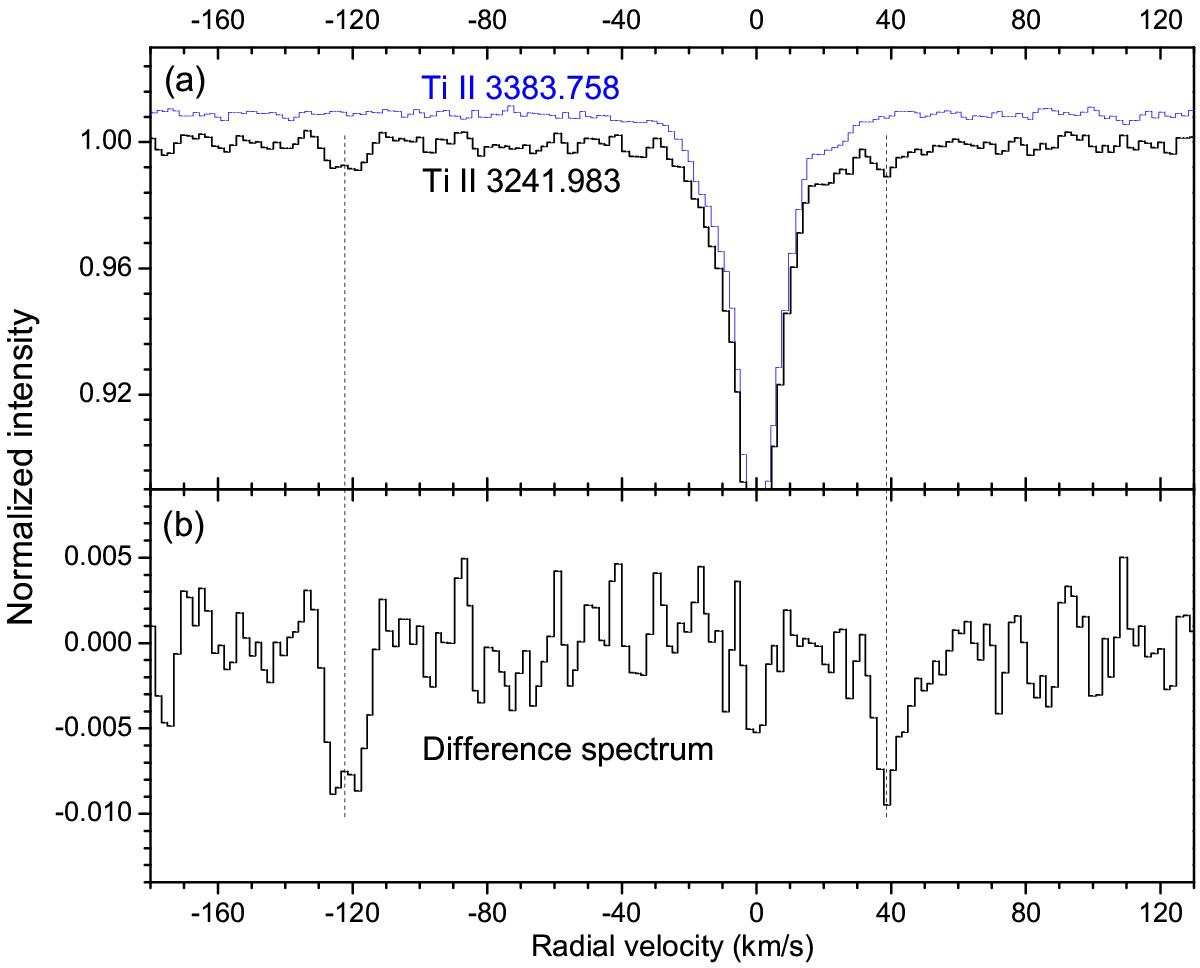
a) Ti II 3242 and 3384 Å lines in our averaged spectrum; b) the difference spectrum of the two Ti II lines in a). For a direct comparison, the two Ti II lines in panel a) are shifted to the radial velocity frame, and the central absorption depth of the 3384 Å line is normalized to that of the 3242 Å line. The two absorption features of SH we identified are marked by vertical dashed lines.
Current usage metrics show cumulative count of Article Views (full-text article views including HTML views, PDF and ePub downloads, according to the available data) and Abstracts Views on Vision4Press platform.
Data correspond to usage on the plateform after 2015. The current usage metrics is available 48-96 hours after online publication and is updated daily on week days.
Initial download of the metrics may take a while.