Fig. 6
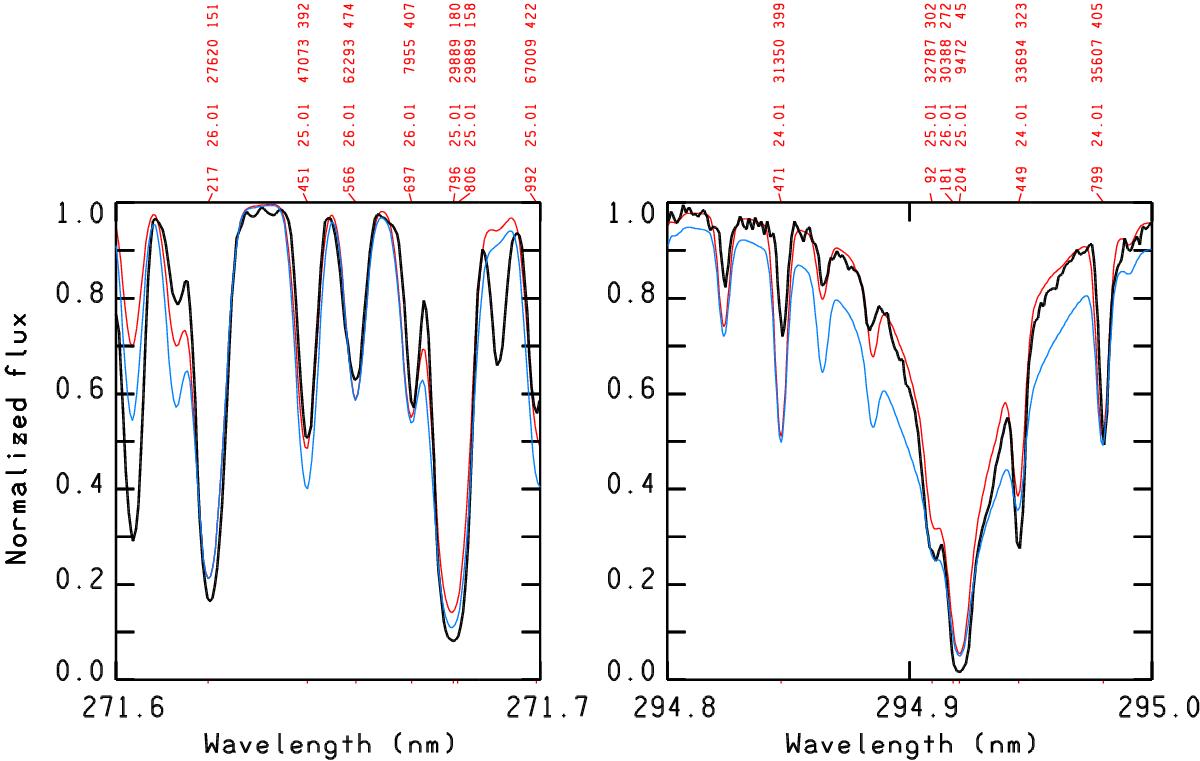
Comparison of the observed spectrum (black line) with synthetic spectra computed for a manganese abundance of −4.2 dex (red line) and −3.8 dex (blue line). The plot on the left shows how the computed core of the line at 2716.793 Å increases with increasing abundance, although it does not fit the observed spectrum even with −3.8 dex. A still larger abundance would develop unobserved wings. The line is computed with the hyperfine structure included. The strongest hyperfine components are those at 2716.796 Å and 2716.806 Å. The plot on the right shows how the wings of the strong Mn ii line at 2949.204 Å are well fitted by the profile computed with the abundance of −4.2 dex. The higher abundance gives rise to unobserved wings. The meaning of the labels is the same as in Fig. 1.
Current usage metrics show cumulative count of Article Views (full-text article views including HTML views, PDF and ePub downloads, according to the available data) and Abstracts Views on Vision4Press platform.
Data correspond to usage on the plateform after 2015. The current usage metrics is available 48-96 hours after online publication and is updated daily on week days.
Initial download of the metrics may take a while.