Fig. 1
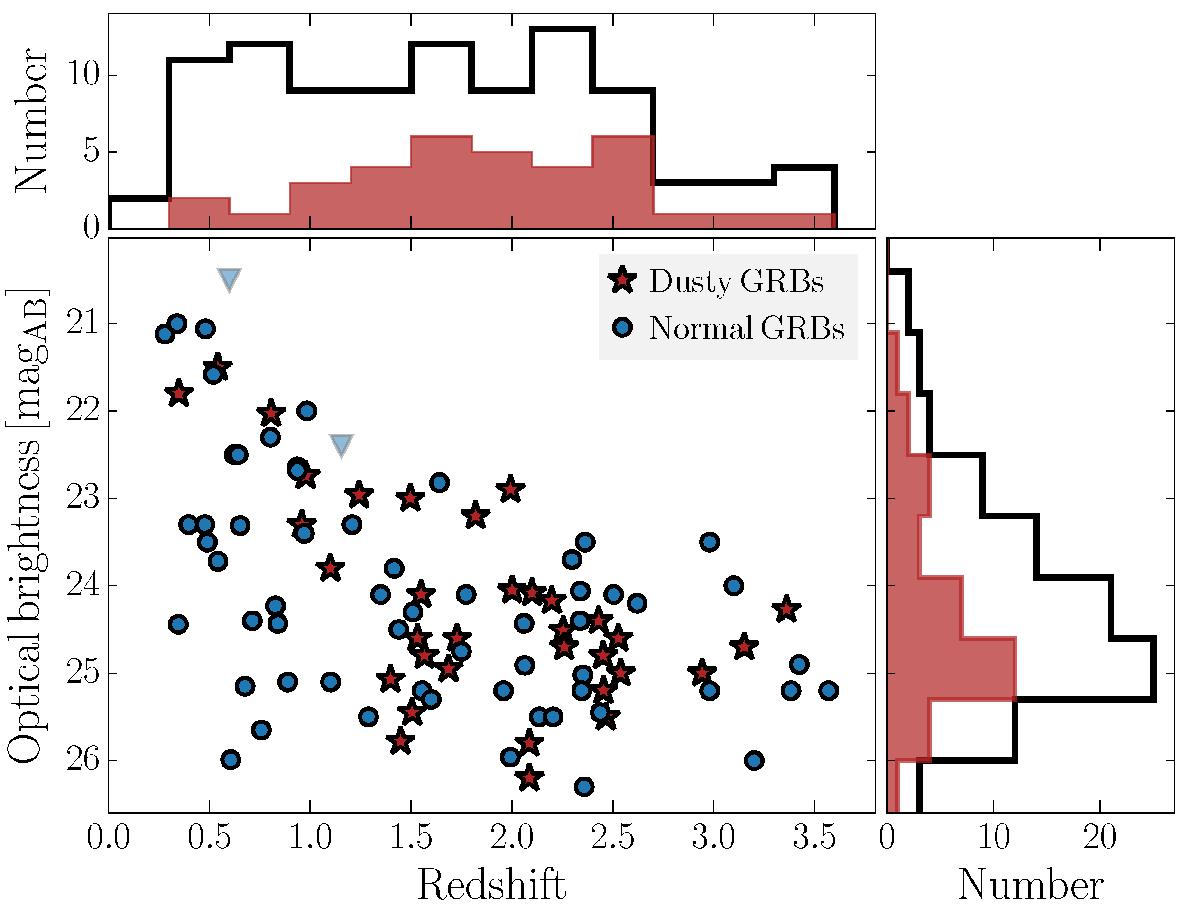
Brightness and redshift distribution of the galaxies in our sample. Magnitudes are primarily measured in the R/r filter (94% of the sample). For the remaining hosts, V or I/i-band magnitudes are shown. Upper limits come from events for which the spectral continuum was dominated by a bright afterglow, they are denoted by downward triangles and are not included in the brightness histogram. Galaxies that hosted dusty GRBs (sightline ![]() ) are indicated by red stars and red-filled histograms.
) are indicated by red stars and red-filled histograms.
Current usage metrics show cumulative count of Article Views (full-text article views including HTML views, PDF and ePub downloads, according to the available data) and Abstracts Views on Vision4Press platform.
Data correspond to usage on the plateform after 2015. The current usage metrics is available 48-96 hours after online publication and is updated daily on week days.
Initial download of the metrics may take a while.