Free Access
Fig. 10
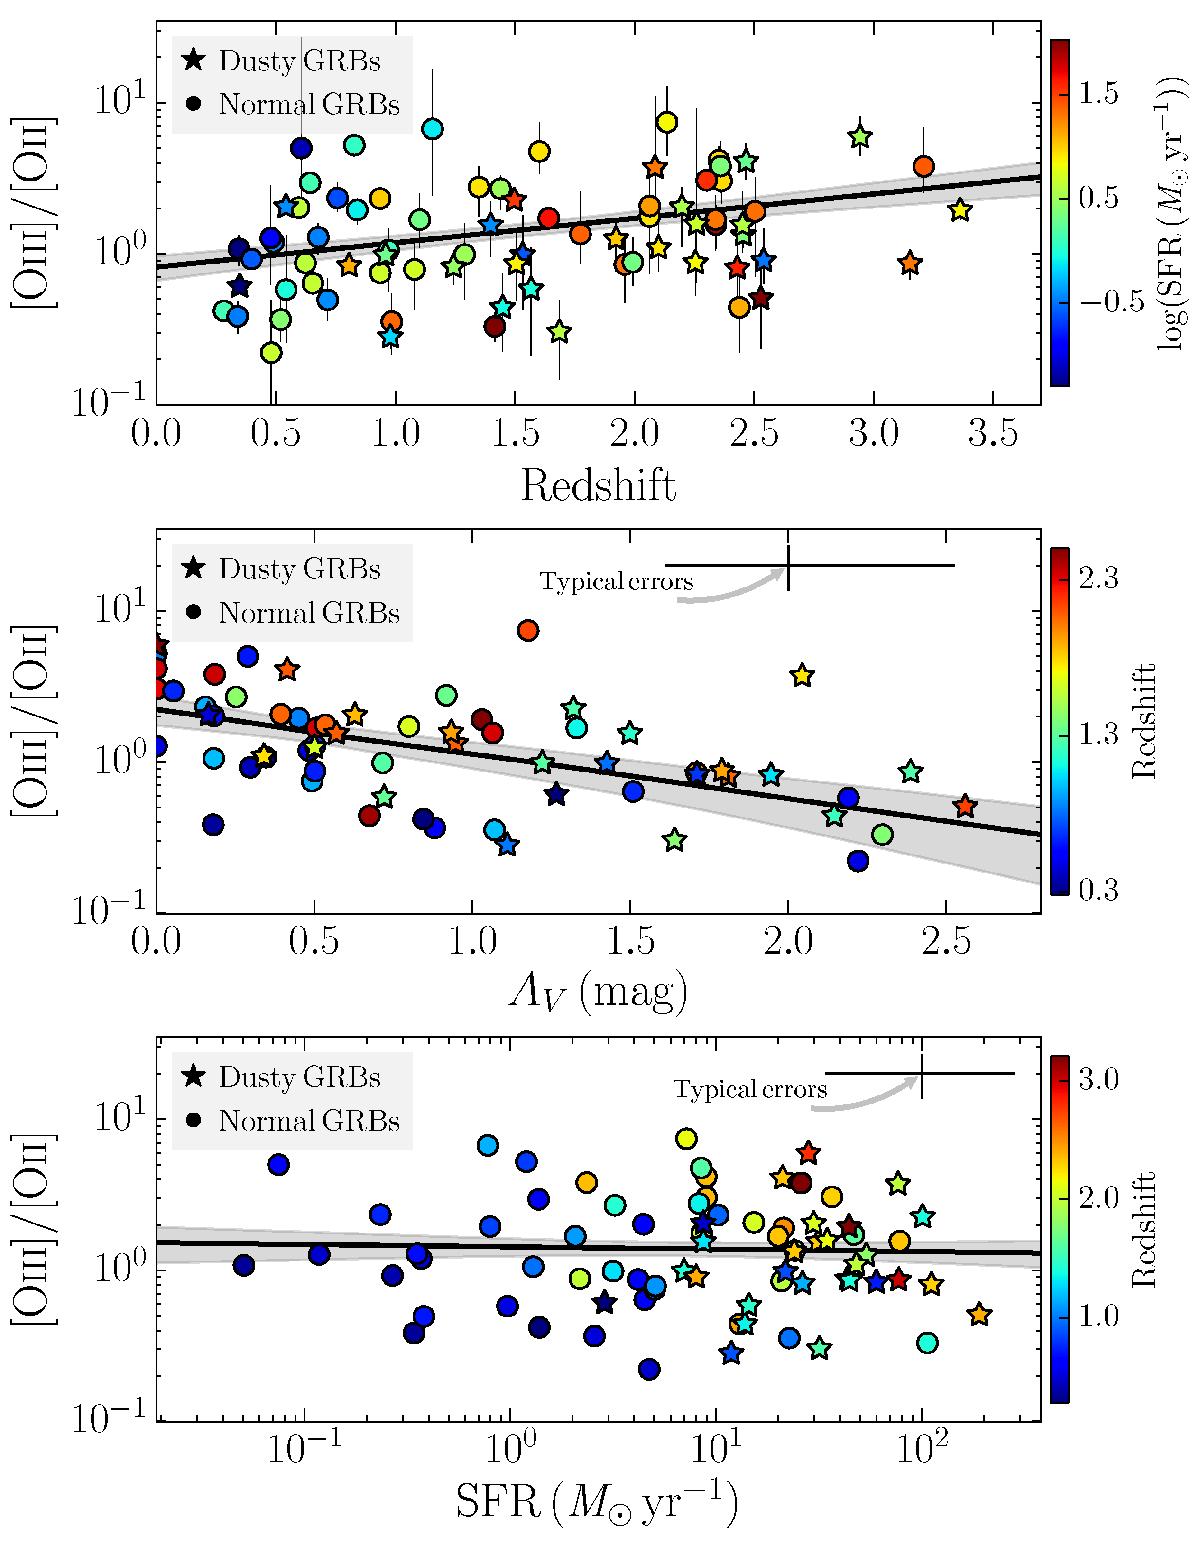
[O iii]/[O ii] as a function of (from top to bottom): redshift, galaxy AV, and SFR. The color of individual data points are according to the color bars. In all panels, solid lines denote the most-likely linear regression, with regions of 68% probability in shaded areas. Dusty/normal GRBs are indicated by stars/circles.
Current usage metrics show cumulative count of Article Views (full-text article views including HTML views, PDF and ePub downloads, according to the available data) and Abstracts Views on Vision4Press platform.
Data correspond to usage on the plateform after 2015. The current usage metrics is available 48-96 hours after online publication and is updated daily on week days.
Initial download of the metrics may take a while.