Fig. 11
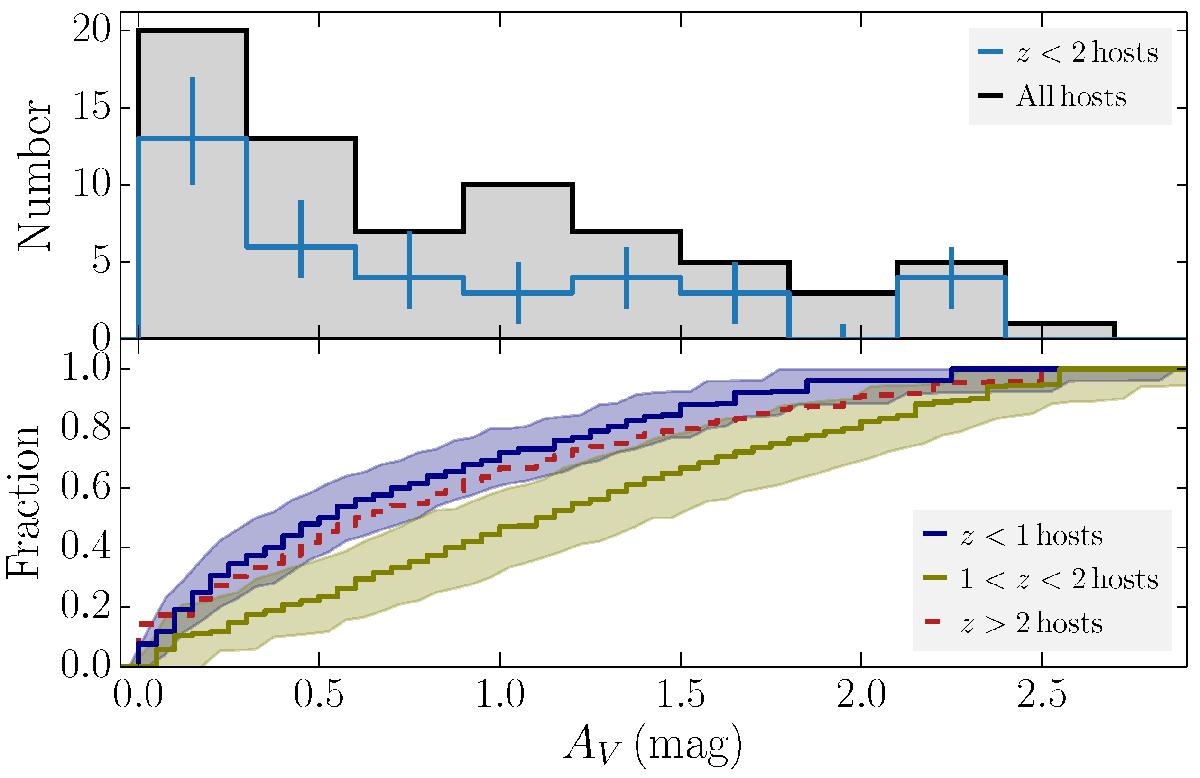
Blue solid histogram and error-bars in the top panel AV distribution for z< 2 GRB from the statistical analysis (Sect. 2.3.3 and Sect. 2.4). The black histogram represents all raw measurements without corrections. Lower panel: the cumulative distribution of AV and its uncertainty from z< 1 hosts (dark blue) and 1 <z< 2 hosts (olive). The red dashed line shows z> 2 hosts (error region not shown).
Current usage metrics show cumulative count of Article Views (full-text article views including HTML views, PDF and ePub downloads, according to the available data) and Abstracts Views on Vision4Press platform.
Data correspond to usage on the plateform after 2015. The current usage metrics is available 48-96 hours after online publication and is updated daily on week days.
Initial download of the metrics may take a while.