Fig. 12
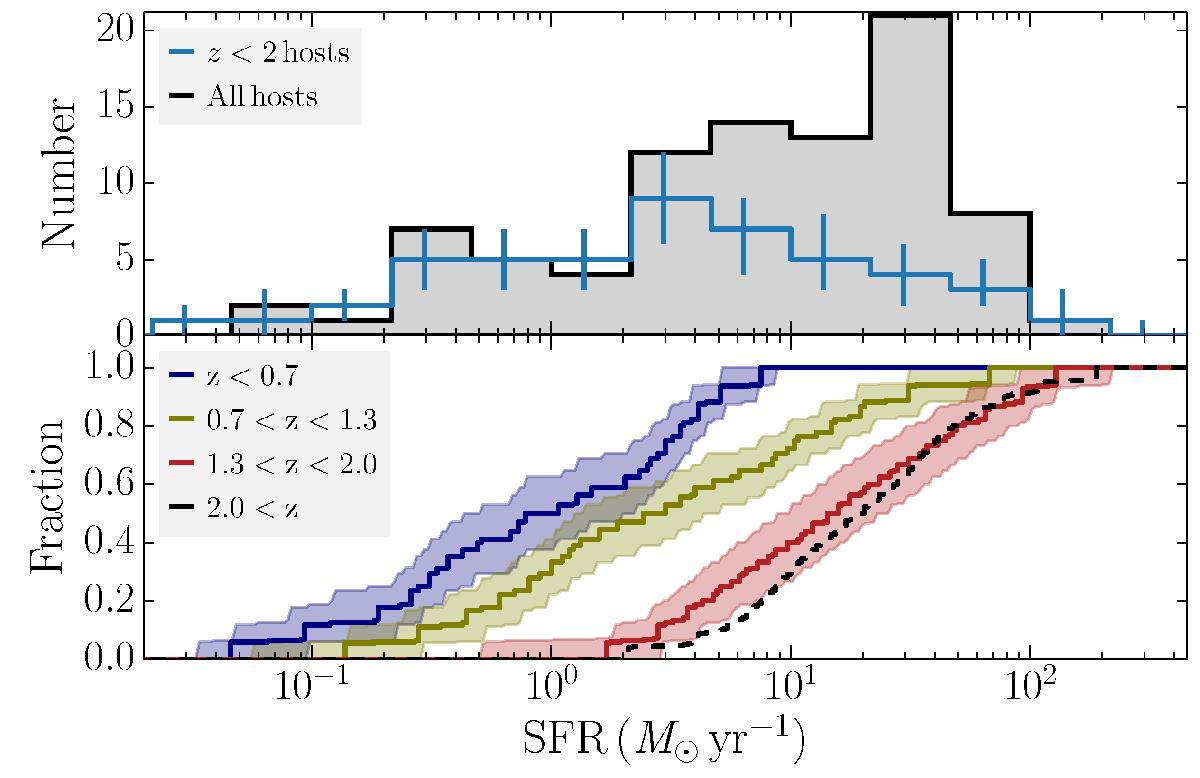
Blue solid histogram with error bars in the top panel: SFR distribution and its uncertainty of z< 2 GRBs, where we have applied the correction for the over-proportionality of dusty GRBs in the sample (Sects. 2.3.3 and 2.4). Black data show all raw measurements without corrections. Lower panel: cumulative distributions of SFR and its uncertainty of z< 0.7 hosts (dark blue), 0.7 <z< 1.3 hosts (olive) and, 1.3 <z< 2.0 hosts (red), in the same way corrected as the blue histogram. The black dashed line denotes hosts at z> 2.
Current usage metrics show cumulative count of Article Views (full-text article views including HTML views, PDF and ePub downloads, according to the available data) and Abstracts Views on Vision4Press platform.
Data correspond to usage on the plateform after 2015. The current usage metrics is available 48-96 hours after online publication and is updated daily on week days.
Initial download of the metrics may take a while.