Fig. 17
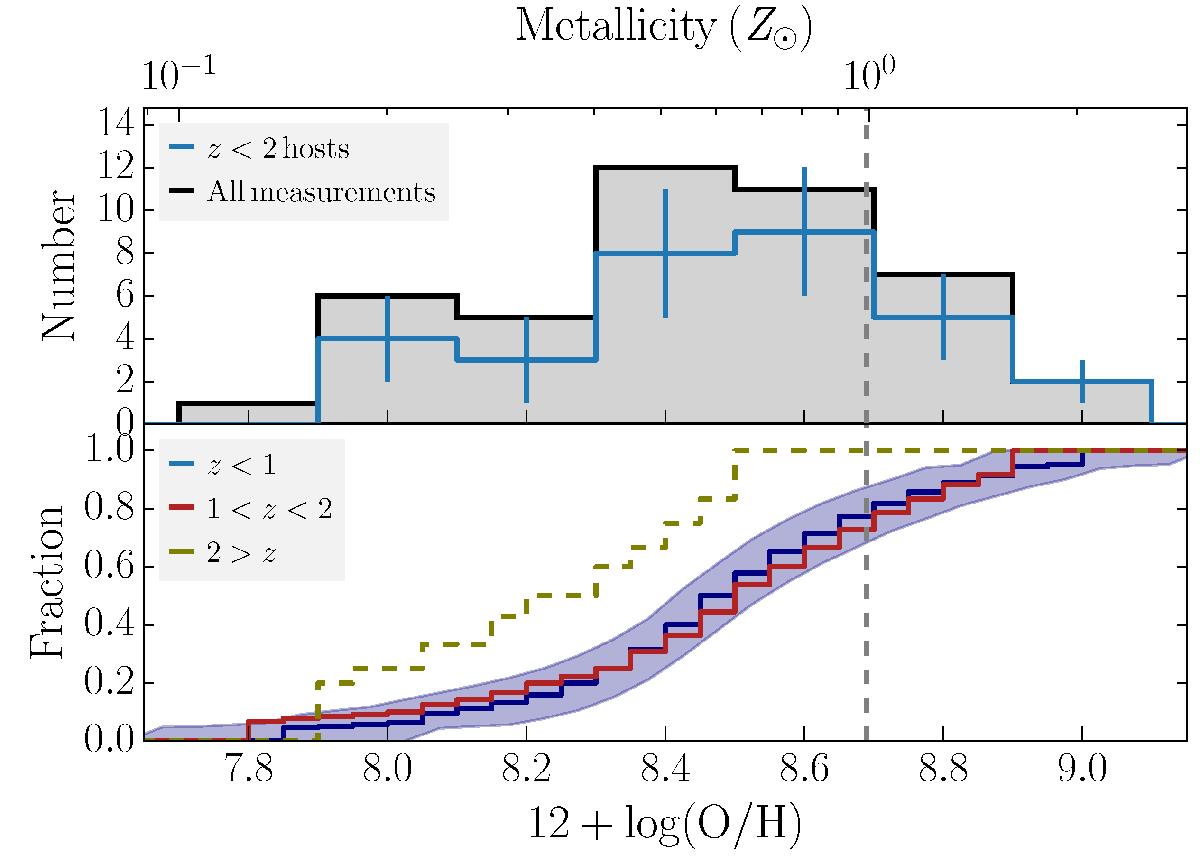
Top panel: histogram of measured oxygen abundances (12 + log (O/H)) derived through strong-line diagnostic ratios in blue following Sects. 2.3.3 and 2.4 and in black for all data. Bottom panel: cumulative distributions of the GRB host metallicities in different redshift intervals, where blue/red/olive colors denote redshift intervals below z = 1 (zmed = 0.6), 1 <z< 2 (zmed = 1.4), and 2 <z (zmed = 2.4), respectively. Z⊙ is indicated by the vertical, gray dashed line. Error-regions of the 1 <z< 2 sample have a similar size to the one for z< 1, but are not shown to enhance clarity.
Current usage metrics show cumulative count of Article Views (full-text article views including HTML views, PDF and ePub downloads, according to the available data) and Abstracts Views on Vision4Press platform.
Data correspond to usage on the plateform after 2015. The current usage metrics is available 48-96 hours after online publication and is updated daily on week days.
Initial download of the metrics may take a while.