Fig. 18
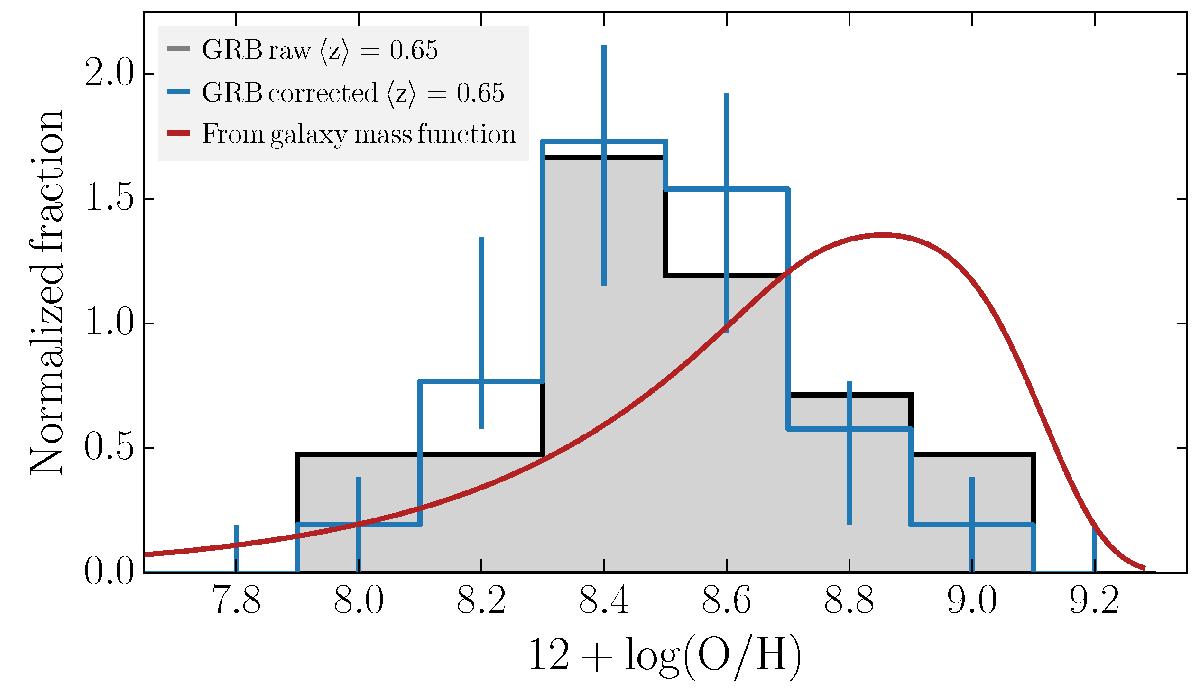
Blue-solid histogram with error bars: metallicity distribution and its uncertainty of 29 0.3 <z< 1 GRB hosts (⟨ z ⟩ = 0.65). We applied a correction for the over-proportionality of dusty GRBs in the sample (Sects. 2.3.3 and 2.4) and for completeness from the line broadening. Black data show raw measurements. The red line is the expectation from the stellar-mass function at a similar redshift (Tomczak et al. 2014) if GRBs traced star formation without metallicity dependence. Shown curves are normalized to an area of 1.
Current usage metrics show cumulative count of Article Views (full-text article views including HTML views, PDF and ePub downloads, according to the available data) and Abstracts Views on Vision4Press platform.
Data correspond to usage on the plateform after 2015. The current usage metrics is available 48-96 hours after online publication and is updated daily on week days.
Initial download of the metrics may take a while.