Fig. 2
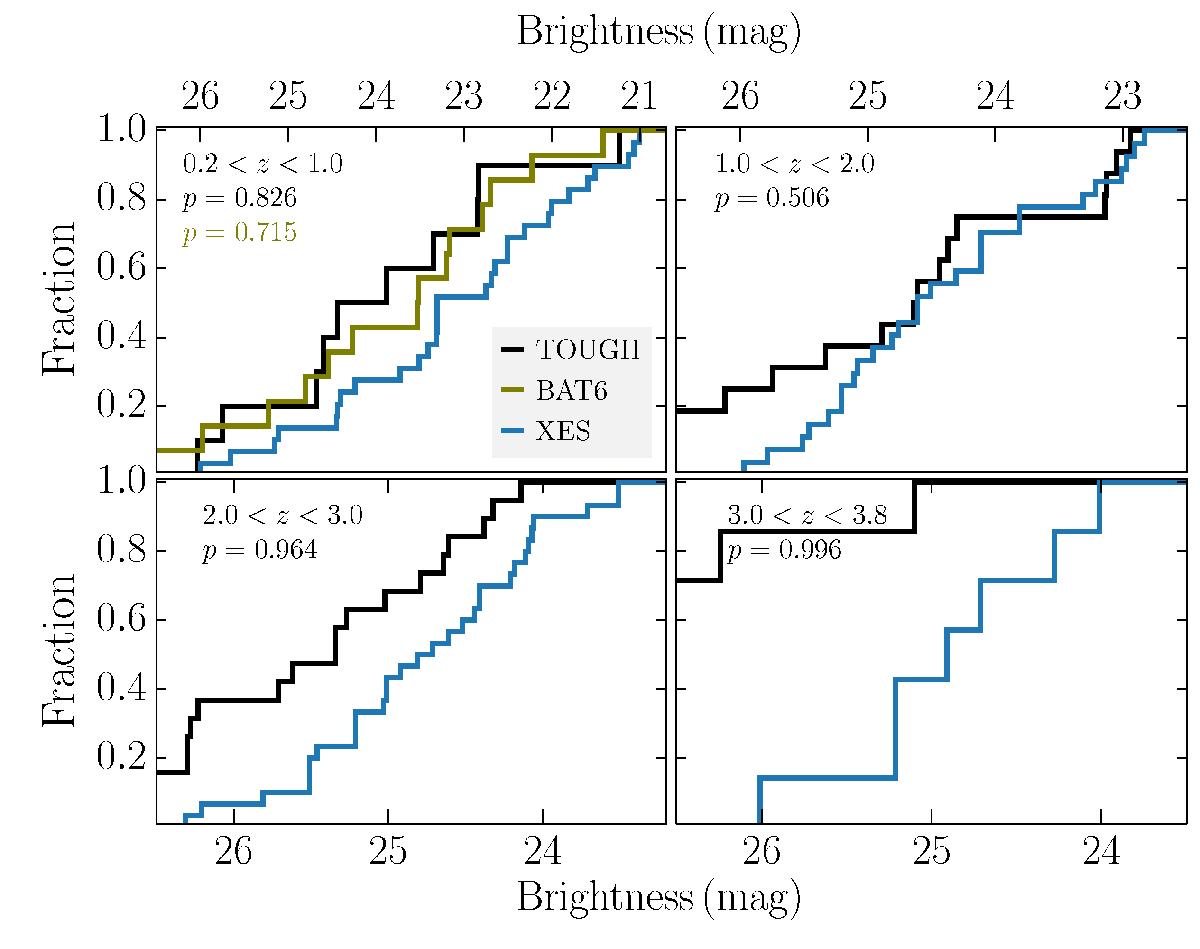
Comparison of the cumulative brightness distributions of the host of our X-Shooter emission-line spectroscopy (XES) in blue against representative GRB host samples in black and olive lines (Hjorth et al. 2012; Vergani et al. 2015). In the top left of each panel, we show the K.S.-test p-value to reject the null-hypothesis that both samples are drawn from a similar parent distribution.
Current usage metrics show cumulative count of Article Views (full-text article views including HTML views, PDF and ePub downloads, according to the available data) and Abstracts Views on Vision4Press platform.
Data correspond to usage on the plateform after 2015. The current usage metrics is available 48-96 hours after online publication and is updated daily on week days.
Initial download of the metrics may take a while.