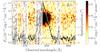
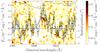
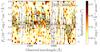
Fig. 6
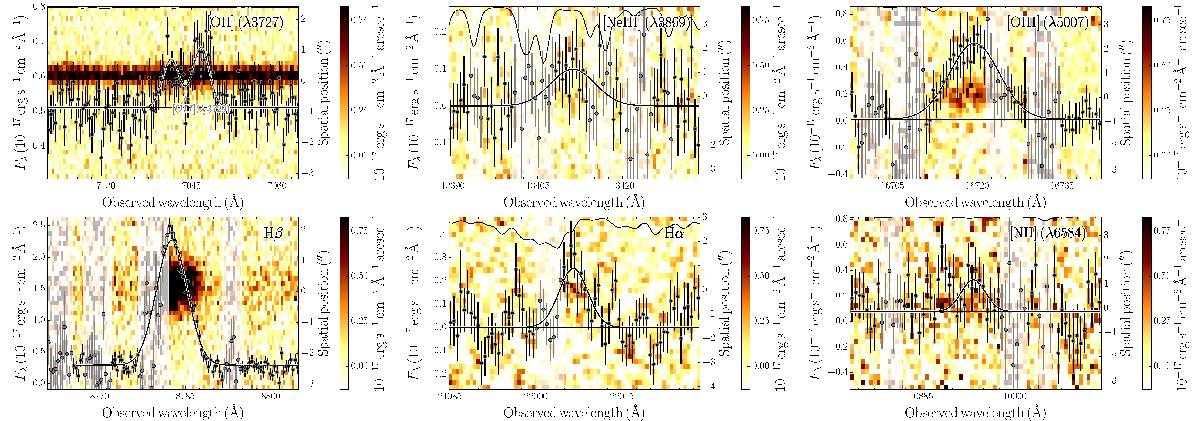
Examples of line-flux measurements for nebular lines at different signal-to-noise level. In each panel, the background is the two-dimensional spectrum, where the spatial direction is plotted against the right y-axis. The color coding is indicated by the color bar. The one-dimensional spectrum with a Gaussian fit are shown in black points and line. Gray data points are excluded from the fit because of telluric or skyline contamination. A telluric transmission spectrum is plotted in a thin black line at the very top of each panel. From top left to bottom right: [O ii] (GRB 140506A, with afterglow background), [Ne iii] (GRB 100424A), [O iii] (GRB 070129), Hβ (GRB 051022), Hα (GRB 070110), [N ii] (GRB 050416A).
Current usage metrics show cumulative count of Article Views (full-text article views including HTML views, PDF and ePub downloads, according to the available data) and Abstracts Views on Vision4Press platform.
Data correspond to usage on the plateform after 2015. The current usage metrics is available 48-96 hours after online publication and is updated daily on week days.
Initial download of the metrics may take a while.