Fig. 7
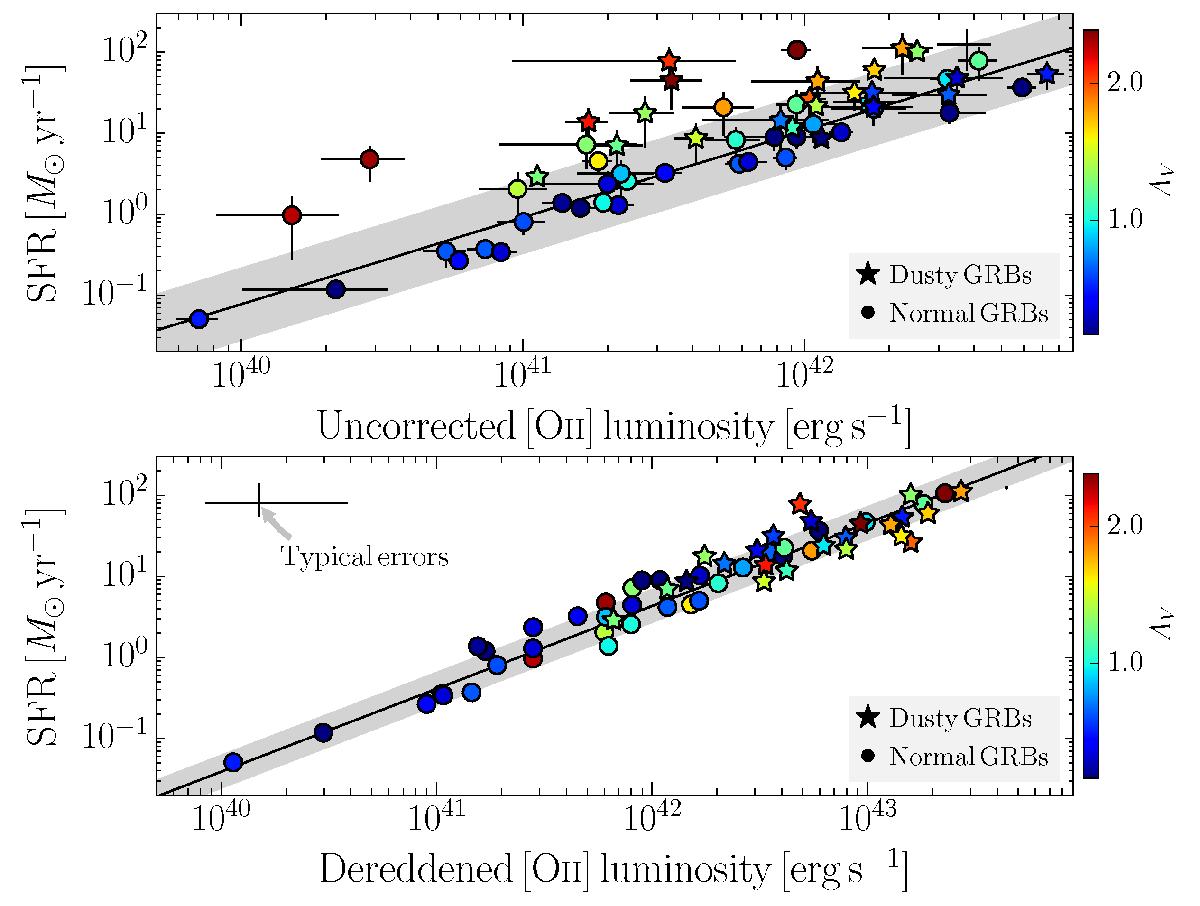
Scaling relations between emission-line luminosity and SFR. Uncorrected/de-reddened [O ii] luminosity against SFR in the upper and lower panel, respectively. Error-bars in the lower panel are omitted to enhance clarity (typical errors in the top left corner). The color-coding of the individual measurements corresponds to AV as indicated by the color bar. The solid black lines show the best-fit scaling relations from Eq. (1). The gray-shaded area denotes the 1σ scatter in the relation − 0.45 dex in the upper and 0.19 dex in the lower panel.
Current usage metrics show cumulative count of Article Views (full-text article views including HTML views, PDF and ePub downloads, according to the available data) and Abstracts Views on Vision4Press platform.
Data correspond to usage on the plateform after 2015. The current usage metrics is available 48-96 hours after online publication and is updated daily on week days.
Initial download of the metrics may take a while.