Fig. 8
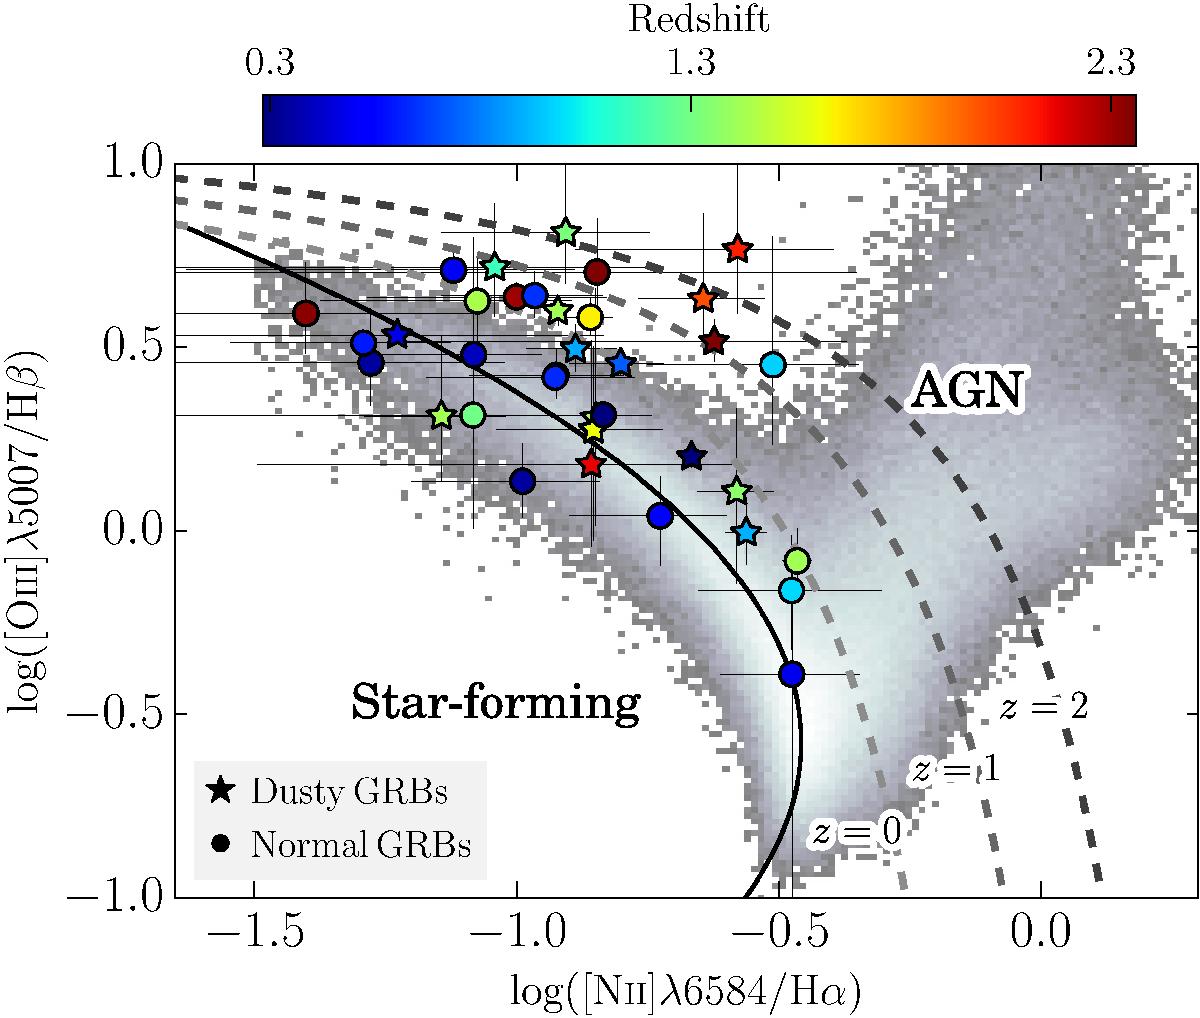
Baldwin-Phillips-Terlevich (BPT) classification diagram for GRB hosts. The background sample is the logarithmic space density of local (z ~ 0) SDSS galaxies with line-fluxes from the MPA/JHU catalog11. Colored circles are 34 individual GRB-selected galaxies with redshifts indicated by the color bar. The increasingly darker dashed gray lines are the redshift-dependent differentiation lines between star-forming galaxies and AGN of Kewley et al. (2013b) at the indicated redshifts. The black solid line is the ridge line, i.e., the line with the highest density of SDSS galaxies. Dusty/normal GRBs are indicated by stars/circles.
Current usage metrics show cumulative count of Article Views (full-text article views including HTML views, PDF and ePub downloads, according to the available data) and Abstracts Views on Vision4Press platform.
Data correspond to usage on the plateform after 2015. The current usage metrics is available 48-96 hours after online publication and is updated daily on week days.
Initial download of the metrics may take a while.