Fig. 9
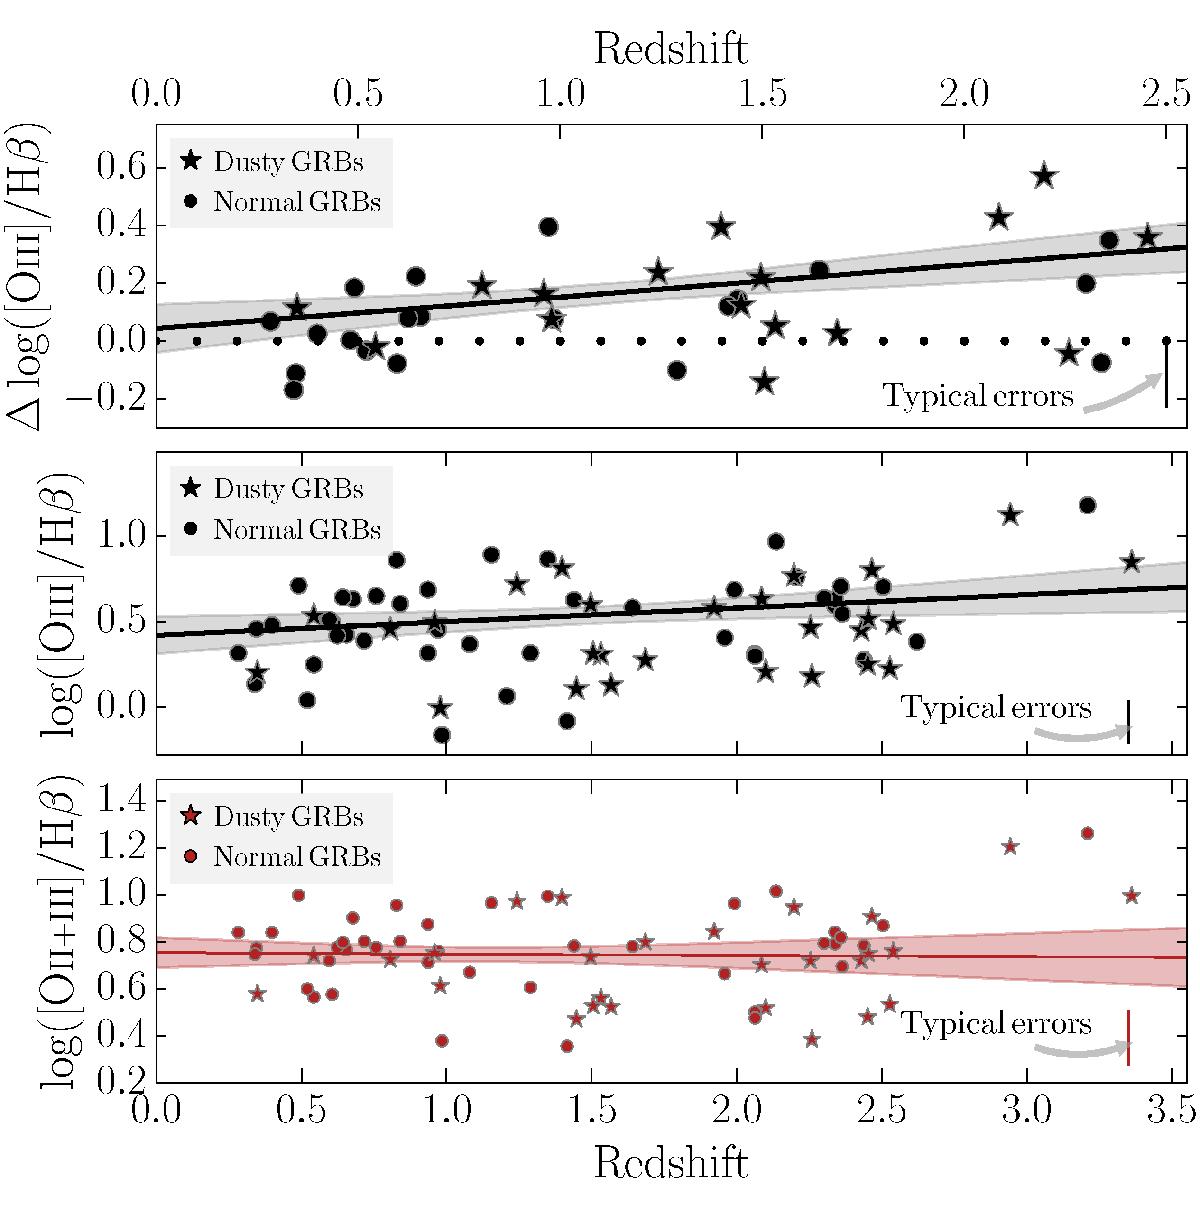
Minimum difference of the GRB hosts from the ridge-line (illustrated by the dots) of z ~ 0 SDSS star-forming galaxies (top panel). We show [O iii]/Hβ in black and ([O iii]+[O ii])/Hβ in red as a function of z in the middle and bottom panel, respectively. In all panels, solid lines denote the most-likely linear regression, with regions of 68% probability in shaded areas. Dusty/normal GRBs are indicated by stars/circles. Error bars are omitted to enhance clarity and replaced by typical errors in the bottom-right corner.
Current usage metrics show cumulative count of Article Views (full-text article views including HTML views, PDF and ePub downloads, according to the available data) and Abstracts Views on Vision4Press platform.
Data correspond to usage on the plateform after 2015. The current usage metrics is available 48-96 hours after online publication and is updated daily on week days.
Initial download of the metrics may take a while.