Fig. 1
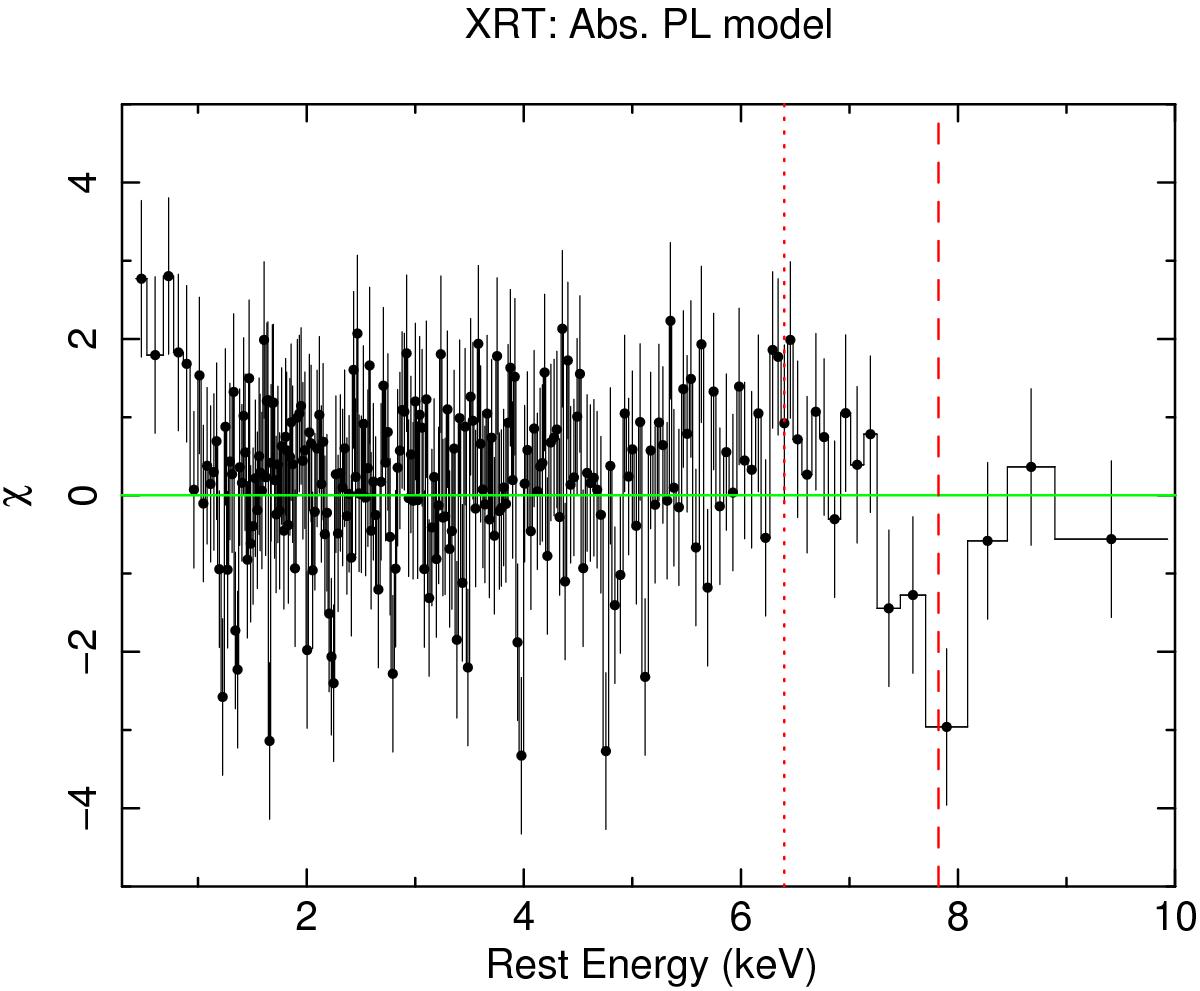
Residuals, plotted in terms of sigma with error bars of size one, for the XRT spectrum, modelled with an absorbed power-law component (Γ ~ 1.5, NH ~ 1.8 × 1022cm-2). A deep absorption trough is seen in the iron K band, possibly associated with a broad absorption feature (dashed red line). The dotted red line marks the position where the neutral Fe Kα emission line is expected (and marginally detected).
Current usage metrics show cumulative count of Article Views (full-text article views including HTML views, PDF and ePub downloads, according to the available data) and Abstracts Views on Vision4Press platform.
Data correspond to usage on the plateform after 2015. The current usage metrics is available 48-96 hours after online publication and is updated daily on week days.
Initial download of the metrics may take a while.