Fig. 1
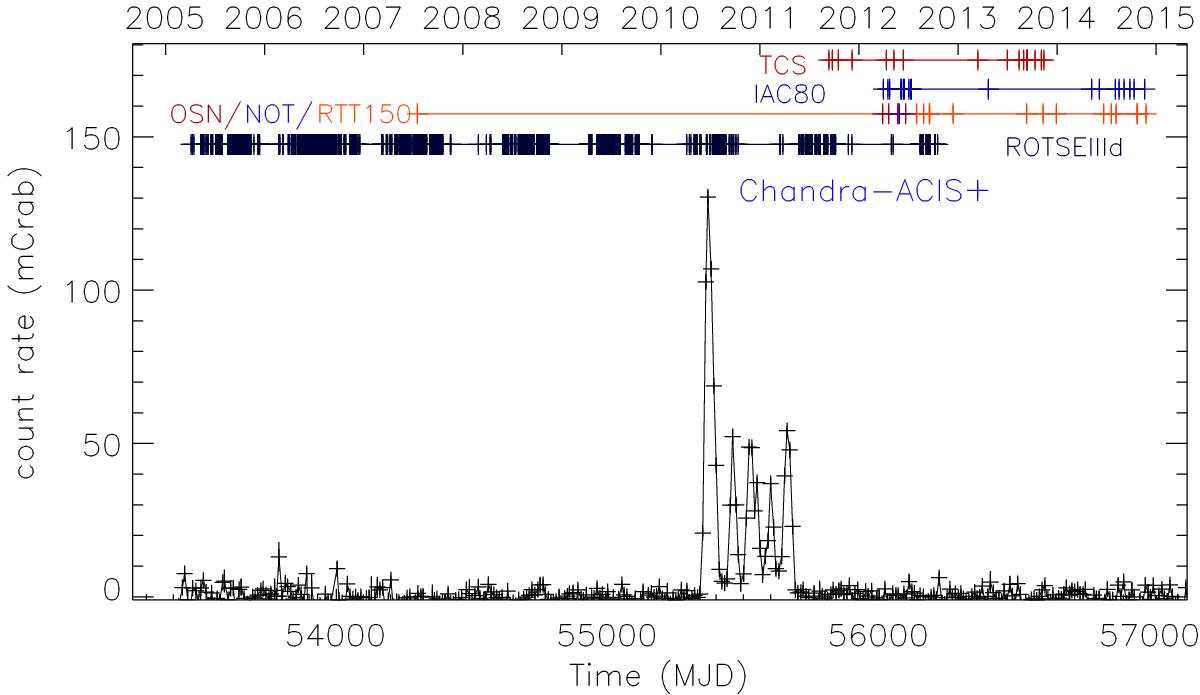
Swift/BAT light-curve (15−50 keV) with a bin size equal to 10 d. Tick marks on the segments located above the light-curve denote the times of the Chandra pointing observation (light blue), as well as the optical/IR photometric data from the ground-based telescopes ROTSEIIId (black), IAC80 (dark blue) and TCS (dark red). The optical spectroscopic observations come from OSN (dark red), NOT (blue) and RTT150 (light red; see also Table 2).
Current usage metrics show cumulative count of Article Views (full-text article views including HTML views, PDF and ePub downloads, according to the available data) and Abstracts Views on Vision4Press platform.
Data correspond to usage on the plateform after 2015. The current usage metrics is available 48-96 hours after online publication and is updated daily on week days.
Initial download of the metrics may take a while.