Fig. 7
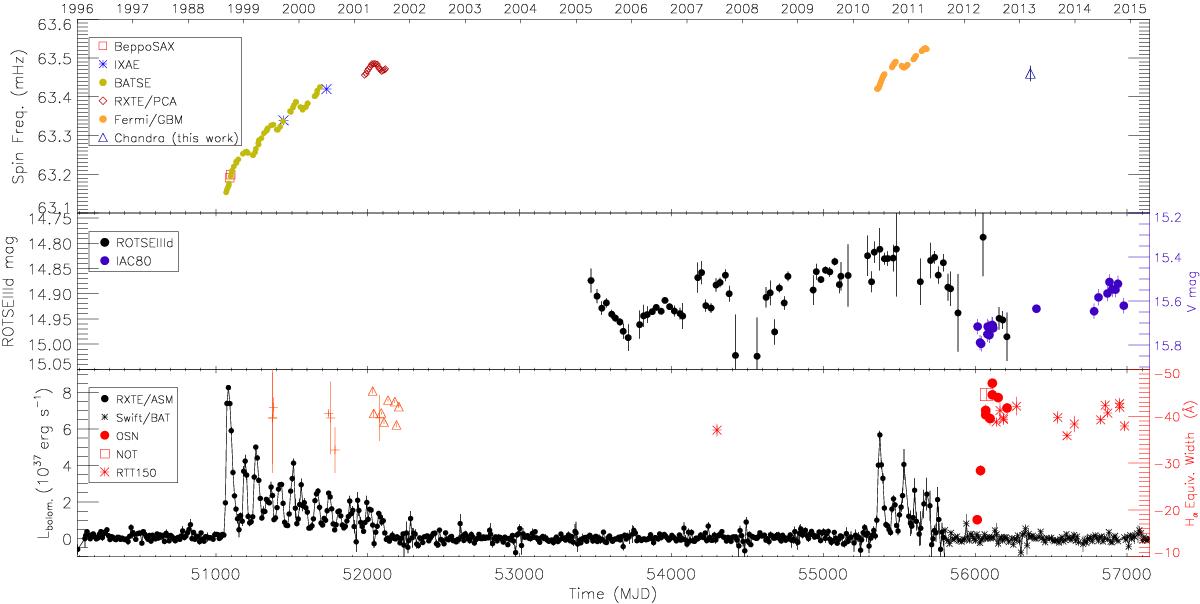
Top: spin frequency history of XTE J1946+274 since its discovery in 1988. Middle: long-term optical light curve of this source. Bottom: long-term X-ray bolometric luminosity, and overplotted the evolution of the EW of the Hα line (red stars, open square, and filled circles). The Hα EW measurements from 1999 to 2002 were extracted from (Verrecchia et al. 2002, red crosses) and Wilson et al. (2003, red triangles). To compute the X-ray bolometric luminosity we follow the procedure by Wilson et al. (2003).
Current usage metrics show cumulative count of Article Views (full-text article views including HTML views, PDF and ePub downloads, according to the available data) and Abstracts Views on Vision4Press platform.
Data correspond to usage on the plateform after 2015. The current usage metrics is available 48-96 hours after online publication and is updated daily on week days.
Initial download of the metrics may take a while.