Fig. 10
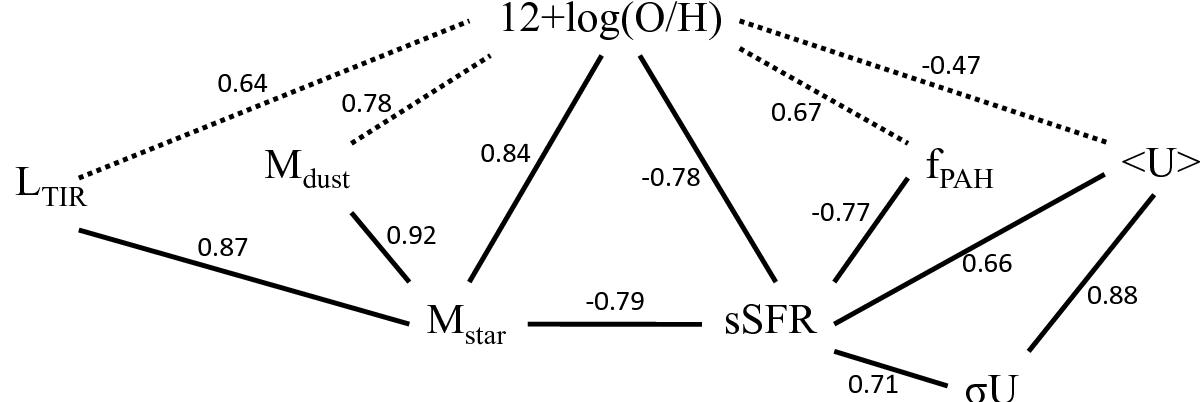
Schematic view of the various correlations between parameters in the DGS and KINGFISH samples. The numbers on the lines are the Spearman correlation coefficients reported from Table 2. The solid lines indicate the dominating correlations between parameters and the dashed lines indicate several secondary correlations of interest.
Current usage metrics show cumulative count of Article Views (full-text article views including HTML views, PDF and ePub downloads, according to the available data) and Abstracts Views on Vision4Press platform.
Data correspond to usage on the plateform after 2015. The current usage metrics is available 48-96 hours after online publication and is updated daily on week days.
Initial download of the metrics may take a while.