Fig. D.2
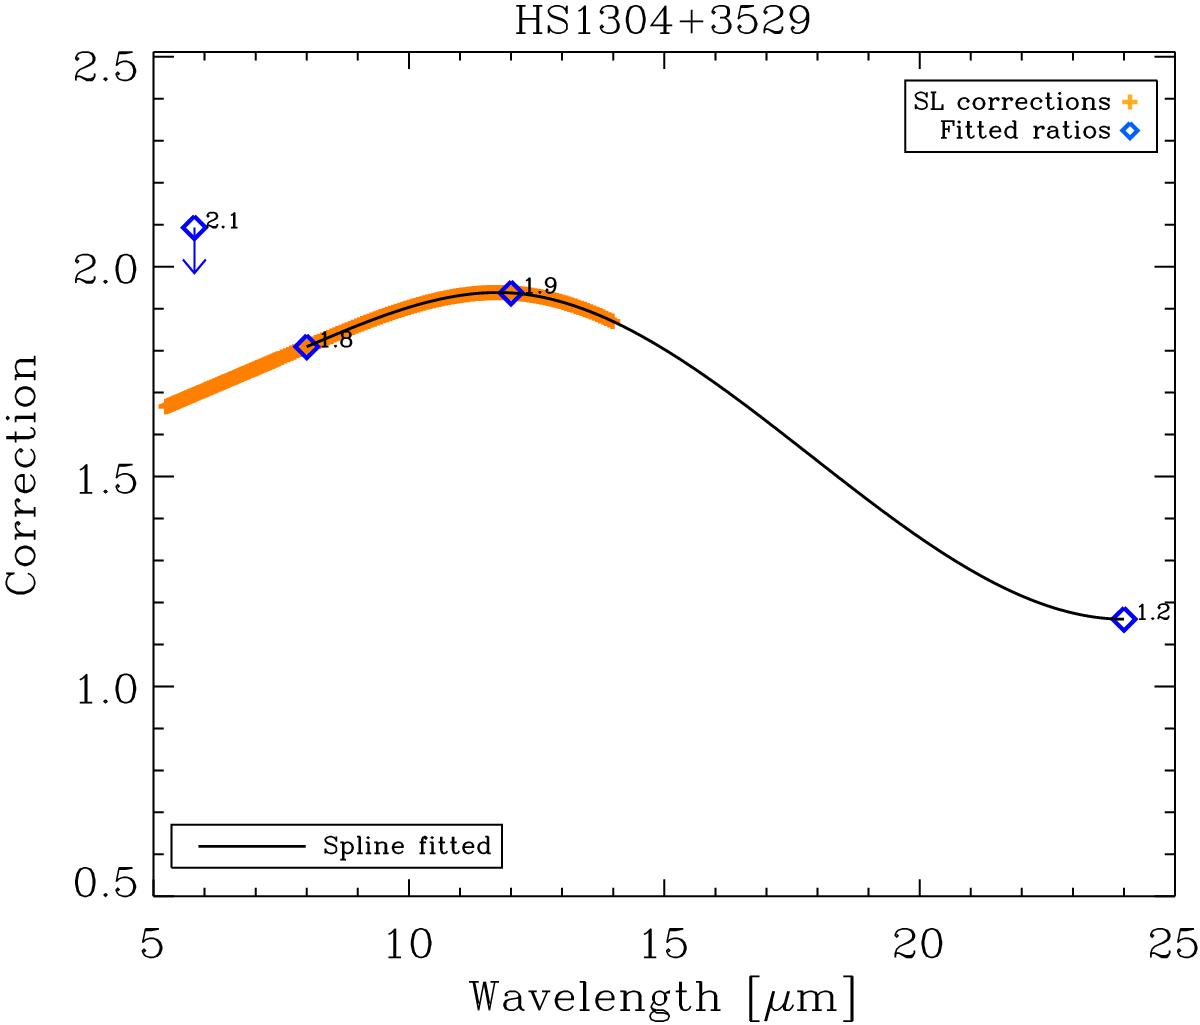
Example of a spline used to rescale SL in the case of HS 1304+3529. The diamonds represent the ratio between the observed and the synthetic photometry. The spline has been fitted to the blue diamonds, except at 5.8 μm where the galaxy is not detected. The black curve is the final adopted spline, sp(x0), where x0 = 1.9. The orange crosses are the corrections applied to the SL part of the spectrum.
Current usage metrics show cumulative count of Article Views (full-text article views including HTML views, PDF and ePub downloads, according to the available data) and Abstracts Views on Vision4Press platform.
Data correspond to usage on the plateform after 2015. The current usage metrics is available 48-96 hours after online publication and is updated daily on week days.
Initial download of the metrics may take a while.