Fig. 3
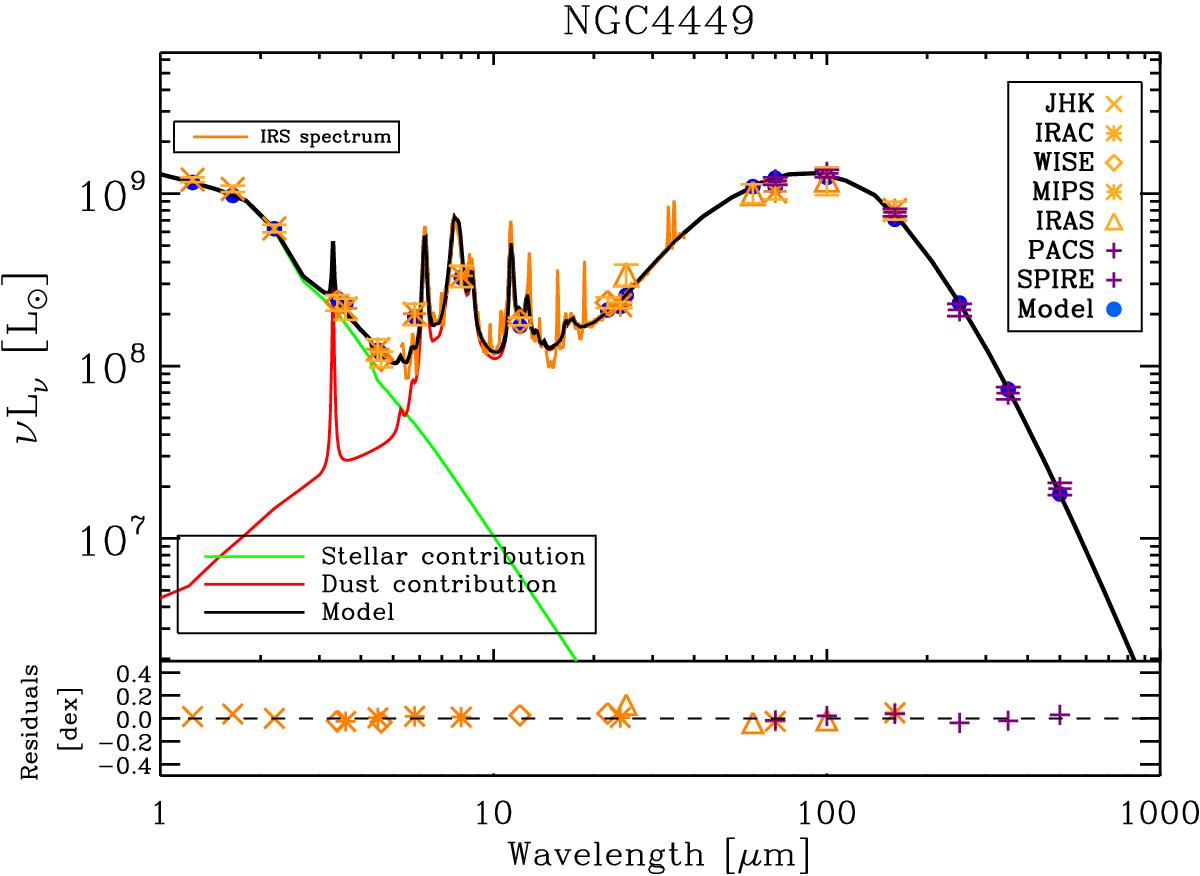
SEDs for a DGS source NGC 4449. The observed SED includes the Herschel data (purple crosses) as well as any available ancillary data (in orange). The different symbols code for the different instruments: Xs for 2MASS bands, stars for Spitzer IRAC and MIPS, diamonds for WISE, and triangles for IRAS. The IRS spectrum is displayed in orange. The total modelled SED in black is the sum of the stellar (green) and dust (red) contributions. The modelled points in the different bands are the filled blue circles. Residuals are shown on the bottom panel.
Current usage metrics show cumulative count of Article Views (full-text article views including HTML views, PDF and ePub downloads, according to the available data) and Abstracts Views on Vision4Press platform.
Data correspond to usage on the plateform after 2015. The current usage metrics is available 48-96 hours after online publication and is updated daily on week days.
Initial download of the metrics may take a while.