Fig. 10
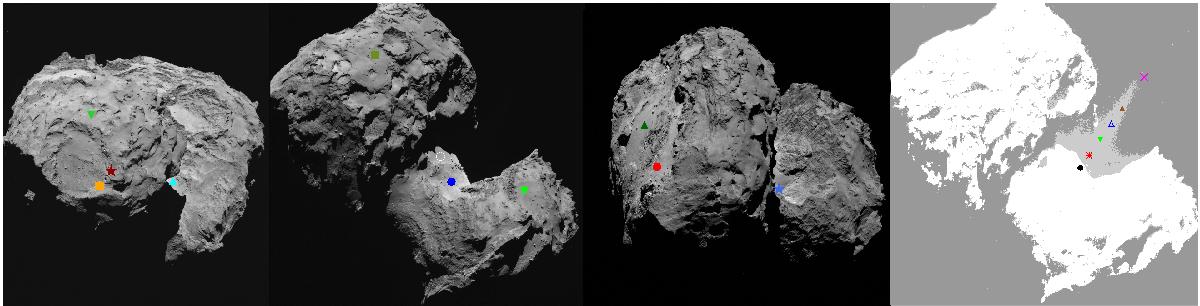
Three images acquired on 6 August at 00:19, 04:19, 06:19 UT, and again 04:19 UT, from left to right. The first three images from the left side show the selected regions where the spectrophotometry on the nucleus has been computed, as represented in Fig. 11. The last image on the right side is taken at 04:19 UT but stretched to show the coma features. The points in this image represent different nucleus and coma regions whose flux is represented in Fig. 12.
Current usage metrics show cumulative count of Article Views (full-text article views including HTML views, PDF and ePub downloads, according to the available data) and Abstracts Views on Vision4Press platform.
Data correspond to usage on the plateform after 2015. The current usage metrics is available 48-96 hours after online publication and is updated daily on week days.
Initial download of the metrics may take a while.