Fig. 7
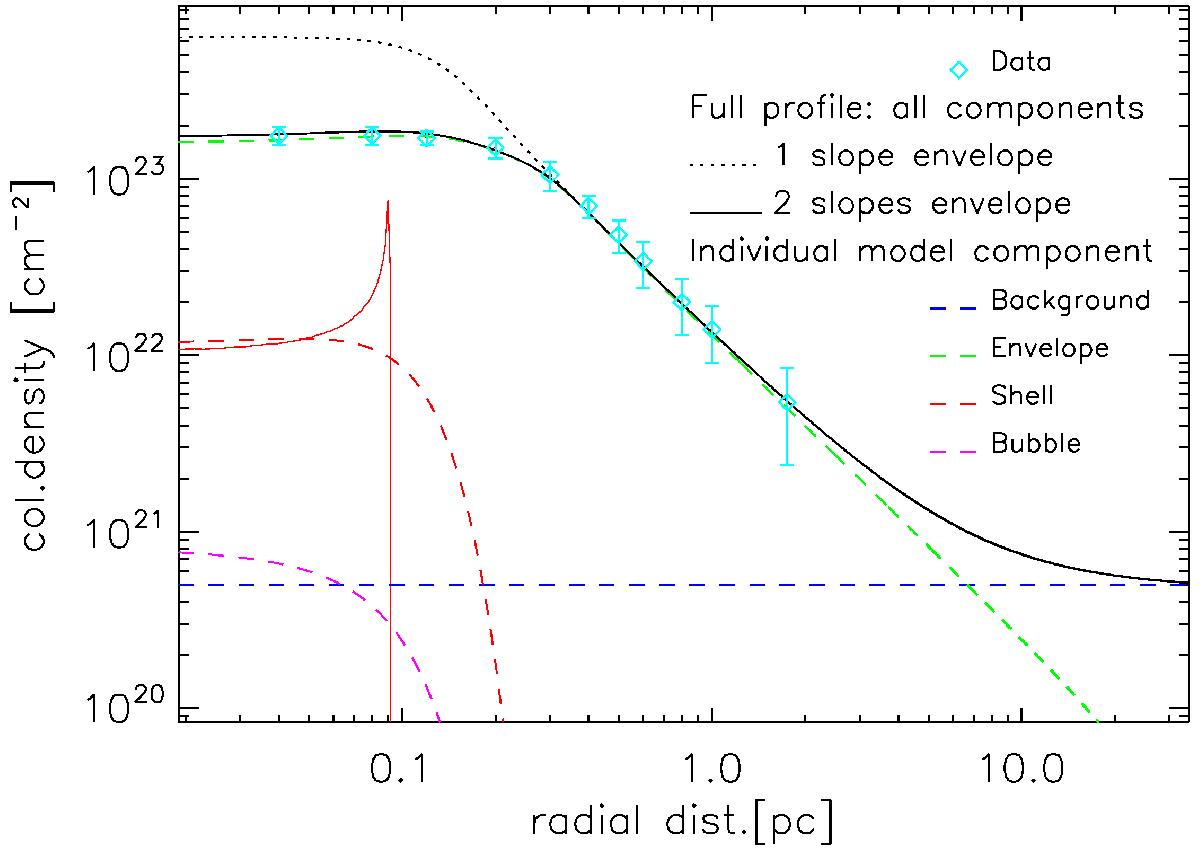
Column density profile of the central UCH ii region (cyan diamonds with σ errors bars) compared to models with all components illustrated in Fig. 3. The neutral envelope with two density gradients or with a single one are shown by a black line and a dotted black line respectively. An envelope model with a single density gradient cannot match the observed data. Individual components after convolution by the beam are shown by magenta, red, green, and blue dashed lines, for the bubble, shell, envelope and background. The continuous red line shows the unconvolved shell profile at an infinite resolution.
Current usage metrics show cumulative count of Article Views (full-text article views including HTML views, PDF and ePub downloads, according to the available data) and Abstracts Views on Vision4Press platform.
Data correspond to usage on the plateform after 2015. The current usage metrics is available 48-96 hours after online publication and is updated daily on week days.
Initial download of the metrics may take a while.