Fig. 1
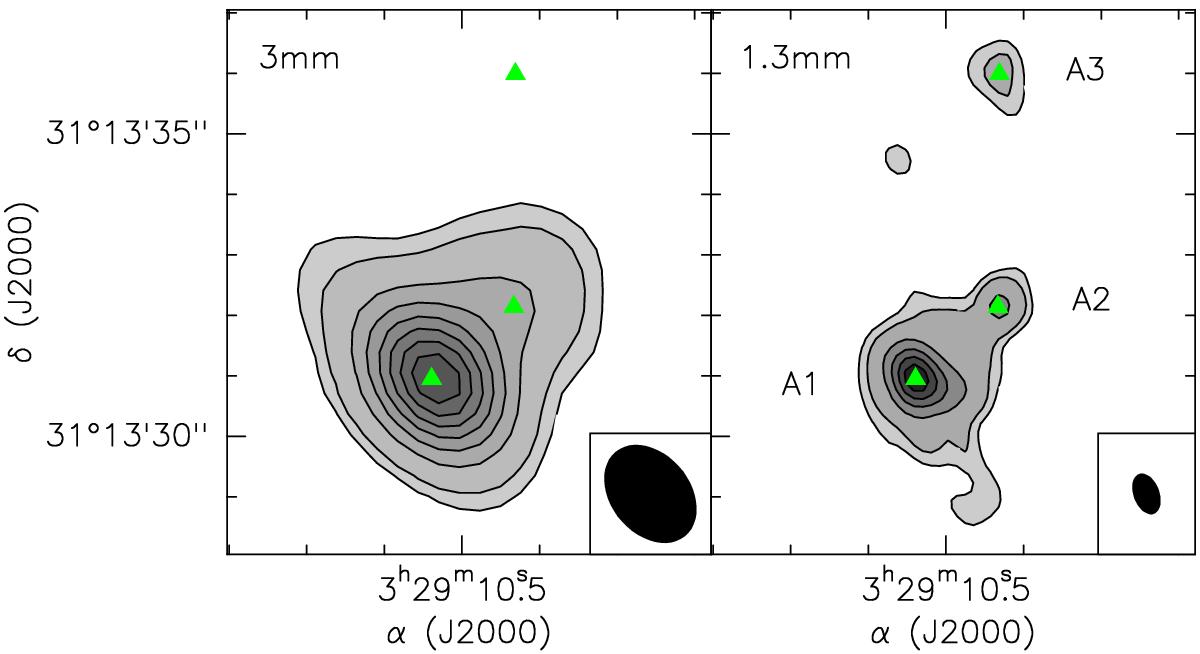
Left: 3 mm continuum emission map of the IRAS4A region (grey scale and black contours). The contour levels of emission are traced at 5 and 8σ levels and increase in steps of 10σ, where σ = 2 mJy beam-1. The positions of the continuum sources at 1.3 mm are marked in green. The PdBI synthesised beam (HPBW) of the continuum map is shown. Right: 1.3 mm continuum map of IRAS4A. Contour levels and labels are the same as in the left panel. The rms noise is σ = 8 mJy beam-1.
Current usage metrics show cumulative count of Article Views (full-text article views including HTML views, PDF and ePub downloads, according to the available data) and Abstracts Views on Vision4Press platform.
Data correspond to usage on the plateform after 2015. The current usage metrics is available 48-96 hours after online publication and is updated daily on week days.
Initial download of the metrics may take a while.