Fig. 3
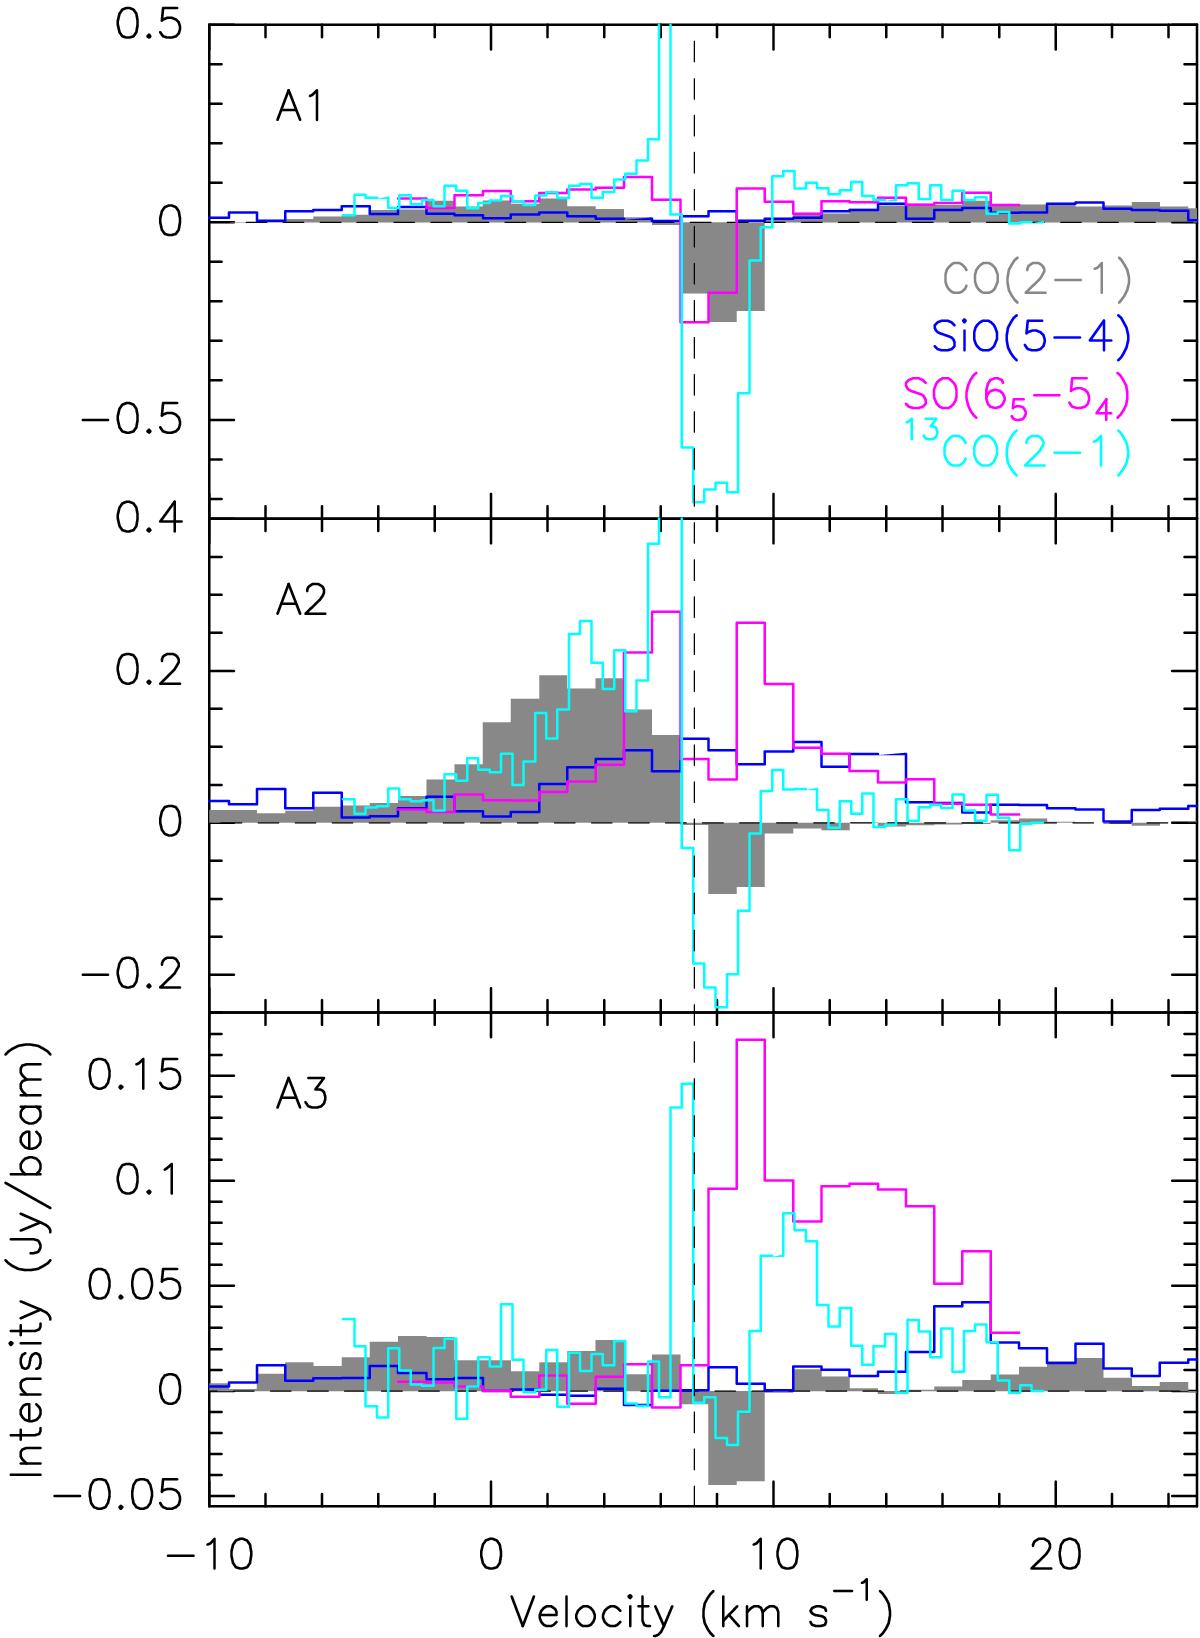
12CO(2−1) (grey), SiO(5−4) (blue), SO(65−54) (magenta), and 13CO(2−1) (cyan) at the positions of the continuum sources A1, A2, and A3 (see Fig. 5). The selected positions are displayed from top to bottom. The 12CO(2−1) data have been convolved to match the angular resolution at 1.4 mm (1.′′1×0.′′8). The vertical dashed line marks the systemic velocity of +7.2 km s-1 for the three continuum sources. We note that the systemic velocity of A3 has been derived from PdBI N2H+(1−0) observations at 93.17 GHz from our CALYPSO dataset.
Current usage metrics show cumulative count of Article Views (full-text article views including HTML views, PDF and ePub downloads, according to the available data) and Abstracts Views on Vision4Press platform.
Data correspond to usage on the plateform after 2015. The current usage metrics is available 48-96 hours after online publication and is updated daily on week days.
Initial download of the metrics may take a while.